Unsupervised Learning on the Semantic Landscape of Large Language Models Papers
100 LLMs papers are analyzed on their semantic patterns and the underlying hierarchical knowledge structure through unsupervised learning methods.
Notebook Goal
In this notebook, 100 LLM (Large Language Model) papers were analyzed using natural language processing (NLP). All documents will be split into sentences and have there subjects, objects, relations extracted, and represented as a network graph.
While analyzing sentence components can offer insights into general writing patterns, it might only scratch the surface of these documents. Therefore, we employ an unsupervised learning approach by converting sentences into embeddings. By projecting entities into a 300+ dimensional latent space and then mapping them back into a 2D space via t-SNE, we observe that interchangeable words and those with similar meanings tend to cluster together. This clustering not only aids in understanding word relationships but also serves as a structured learning guide, enabling us to compare models and techniques on a similar hierarchical level.
For full analysis with code, please refer to this Kaggle notebook.
Frequency Distribution
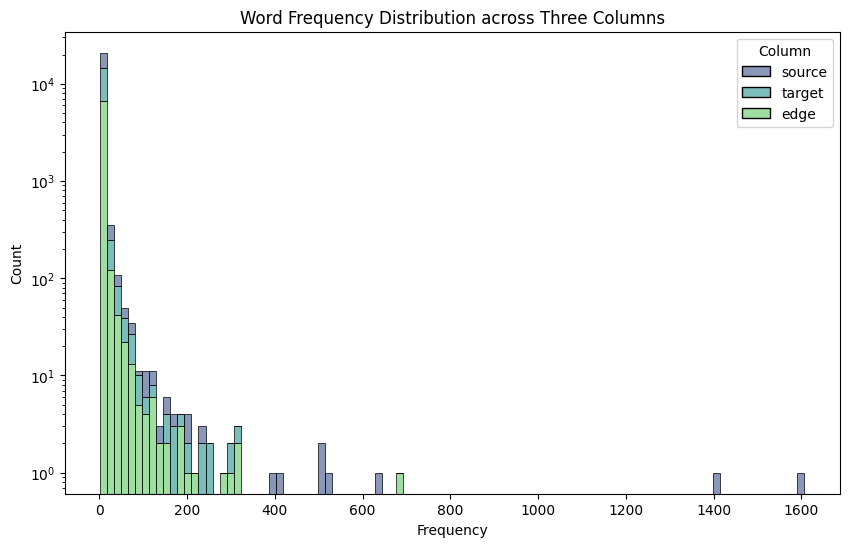
Common subjects in this dataset are consistent with common English usage, but with a notable increase in frequencies for words like “LLMs” and “language models”. Moreover, the fact that these are scientific papers makes words like “model” and “results” appear more frequent since they get used a lot in result and discussion sections of papers.
The histogram of frequency distribution of words indicates that most words appear only once, with a long tail of common words that get used up to 1000 times, such as “that” and “which”.
Network Representation
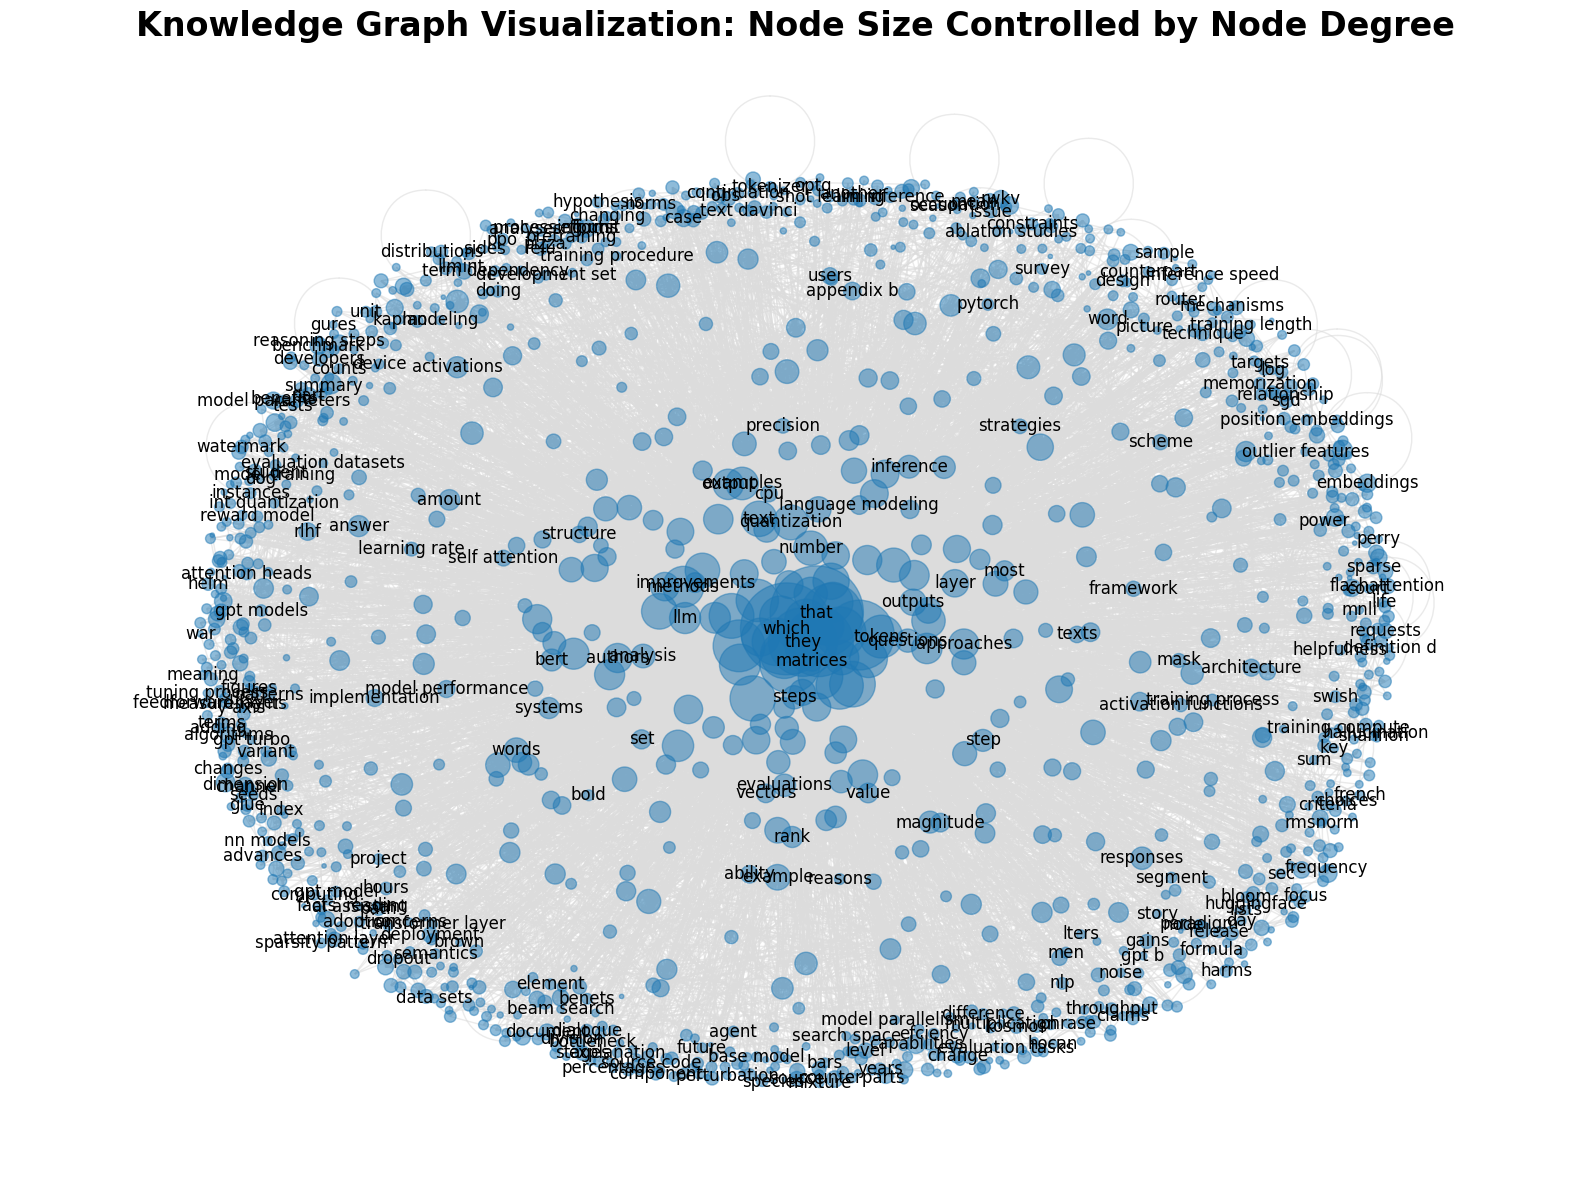
To illustrate the connections between extracted words, we employ the networkx package, treating relations as edges and subjects/objects as nodes to create a network diagram with directional edges. The code is adapted from this tutorial.
Node size in our network graph is determined by the degree of the node, reflecting the number of connections it has. Larger nodes indicate a higher degree of connections, illustrating their centrality and importance in the network.
We apply a high repelling force in the layout to ensure nodes are well-separated, pushing lower-degree nodes to the periphery and allowing those with higher degrees to cluster at the center. This method offers a sophisticated representation of word frequency distribution, placing common words at the core and rarer ones on the outer edges.
Betweenness Centrality and Community Detection
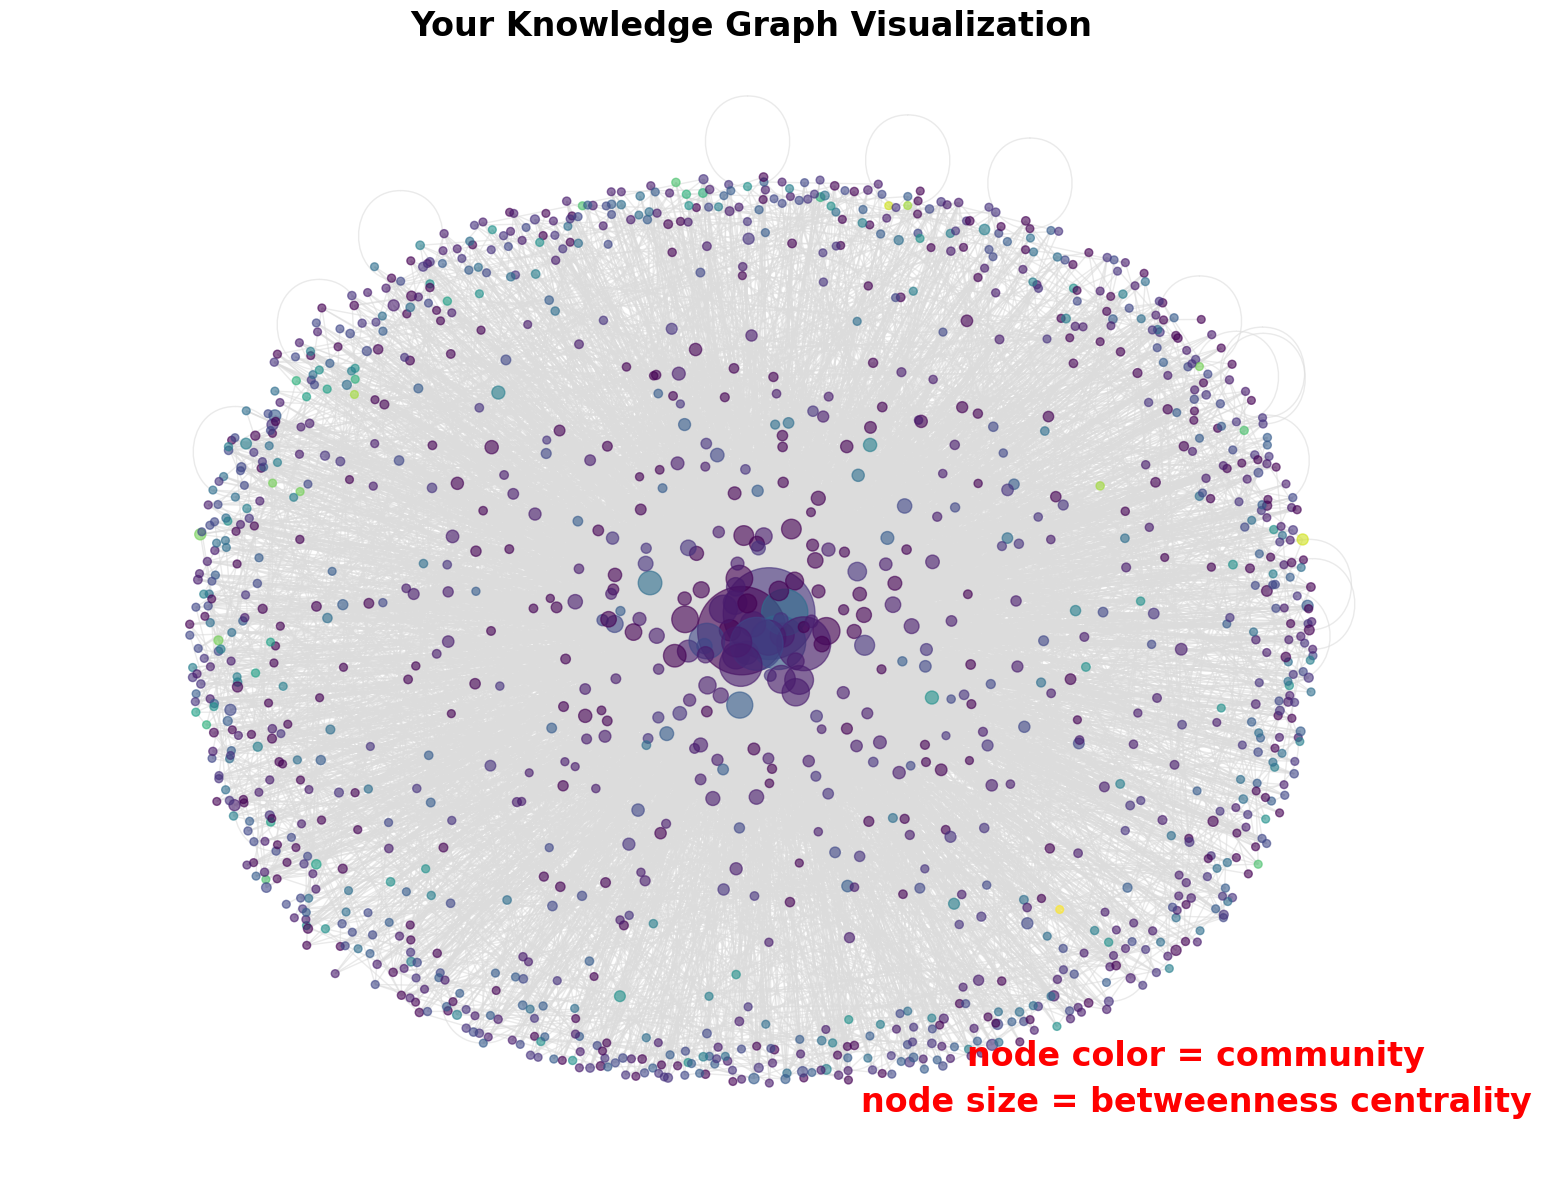
Delving deeper into our network, we analyze node importance through betweenness centrality and community structure.
Betweenness centrality measures a node’s significance based on its frequency of appearing on the shortest paths between other nodes, providing insights into information flow and influence within the network.
Community detection, facilitated by the Clauset-Newman-Moore greedy modularity maximization algorithm, reveals clusters of nodes. This algorithm seeks to maximize modularity, highlighting denser connections within communities compared to between them. The resulting color-coded nodes offer a visual distinction between different communities.
Unsupervised Learning
While the preceding analyses illuminate language patterns and network structures, they barely scratch the surface of the hierarchical knowledge landscape that underpins LLM literature.
Drawing inspiration from a study that employed embedding techniques to decode the vast knowledge embedded in scientific literature, we adopt a similar approach. By mapping words into a high-dimensional latent space, we uncover clusters of terms that share meanings or co-occur frequently, aiding our quest to discern the complex hierarchy of concepts within LLM knowledge.
Create Embedding
Since training an embedding from scratch can be time-consuming, we opt for pre-trained models known for their robust representation of LLM vocabulary. These models, trained on modern computer science literature, offer a shortcut to understanding the lexical landscape of LLMs without the need for extensive re-training or fine-tuning.
Similar Words in High-Dimensional Space
With our embeddings ready, we explore the semantic vicinity of select terms by comparing them against a vocabulary list derived from our subject-object list. This process involves calculating the cosine similarity between the target term’s embedding and those of the vocabulary list, allowing us to identify words with close semantic relationships.
For instance, examining “Transformer XL” reveals closely related terms, highlighting both inclusive and similar terms. This exploration is extended to other key terms, revealing the interconnectedness of concepts within the LLM field.
Top 10 similar words to Transformer XL:
transformer xl
layer transformer xl
transformer
transformer model
linear transformer
enhanced transformer
transformer models
transformer layer
transformers
switch transformer
Top 10 similar words to GPT-3:
gpt
gpt
gpts
gptgpt
gpt some
gpt b
gpt j
h t gpt
school gpt
b gpt
Top 10 similar words to embeddings:
embeddings
word embeddings
input embeddings
position embeddings
byte embeddings
patch embeddings
kvembeddings
j word embeddings
bert embeddings
representations
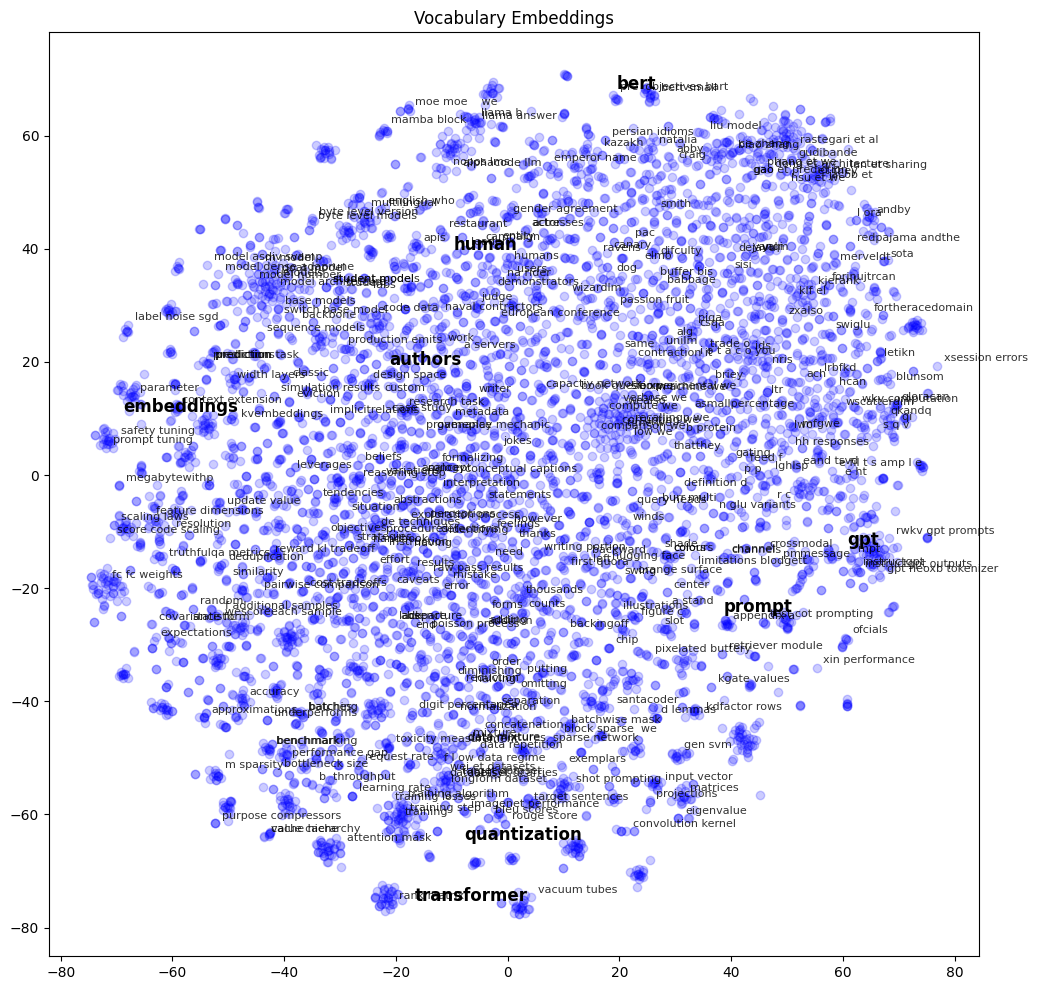
t-SNE (t-distributed Stochastic Neighbor Embedding) Visualizatoin
The final step in our unsupervised learning involves using t-SNE to project the high-dimensional embeddings onto a 2D plane, facilitating a visual exploration of how words cluster based on their semantic similarities.
This visualization underscores the presence of specialized clusters and the general distribution of terms, offering a bird’s-eye view of the conceptual landscape. Although only a fraction of labels are displayed to maintain clarity, the diagram serves as a roadmap for further exploration and understanding of related concepts within the LLM domain.
Conclusions
This comprehensive analysis not only enhances our understanding of LLMs but also paves the way for future research directions. By unraveling the complex web of concepts and their interrelations, we provide a structured framework that can guide both new and seasoned researchers in navigating the vast expanse of LLM literature.