Air Quality Monitoring using Electrochemical Low-Cost Sensor Calibrated by Lasso Regression
This analysis utlizes Lasso regression to explore sparse calibration relationships for electrochemical low-cost sensors developed for air quality monitoring. The performane of Lasso regression is compared with generic multiple linear regression.
Analysis Goal
Urban air quality monitoring requires a dense monitoring network to effectively map out the air quality distribution across regions. However, due to the inherent high cost of certified analyzers, the density of monitoring stations has been low. Low-cost sensors have been proposed as the solution to this challenge as they are cheap to deploy, and they can be calibrated by a certified analyzer for a short time, and then operate in the field for a long time.
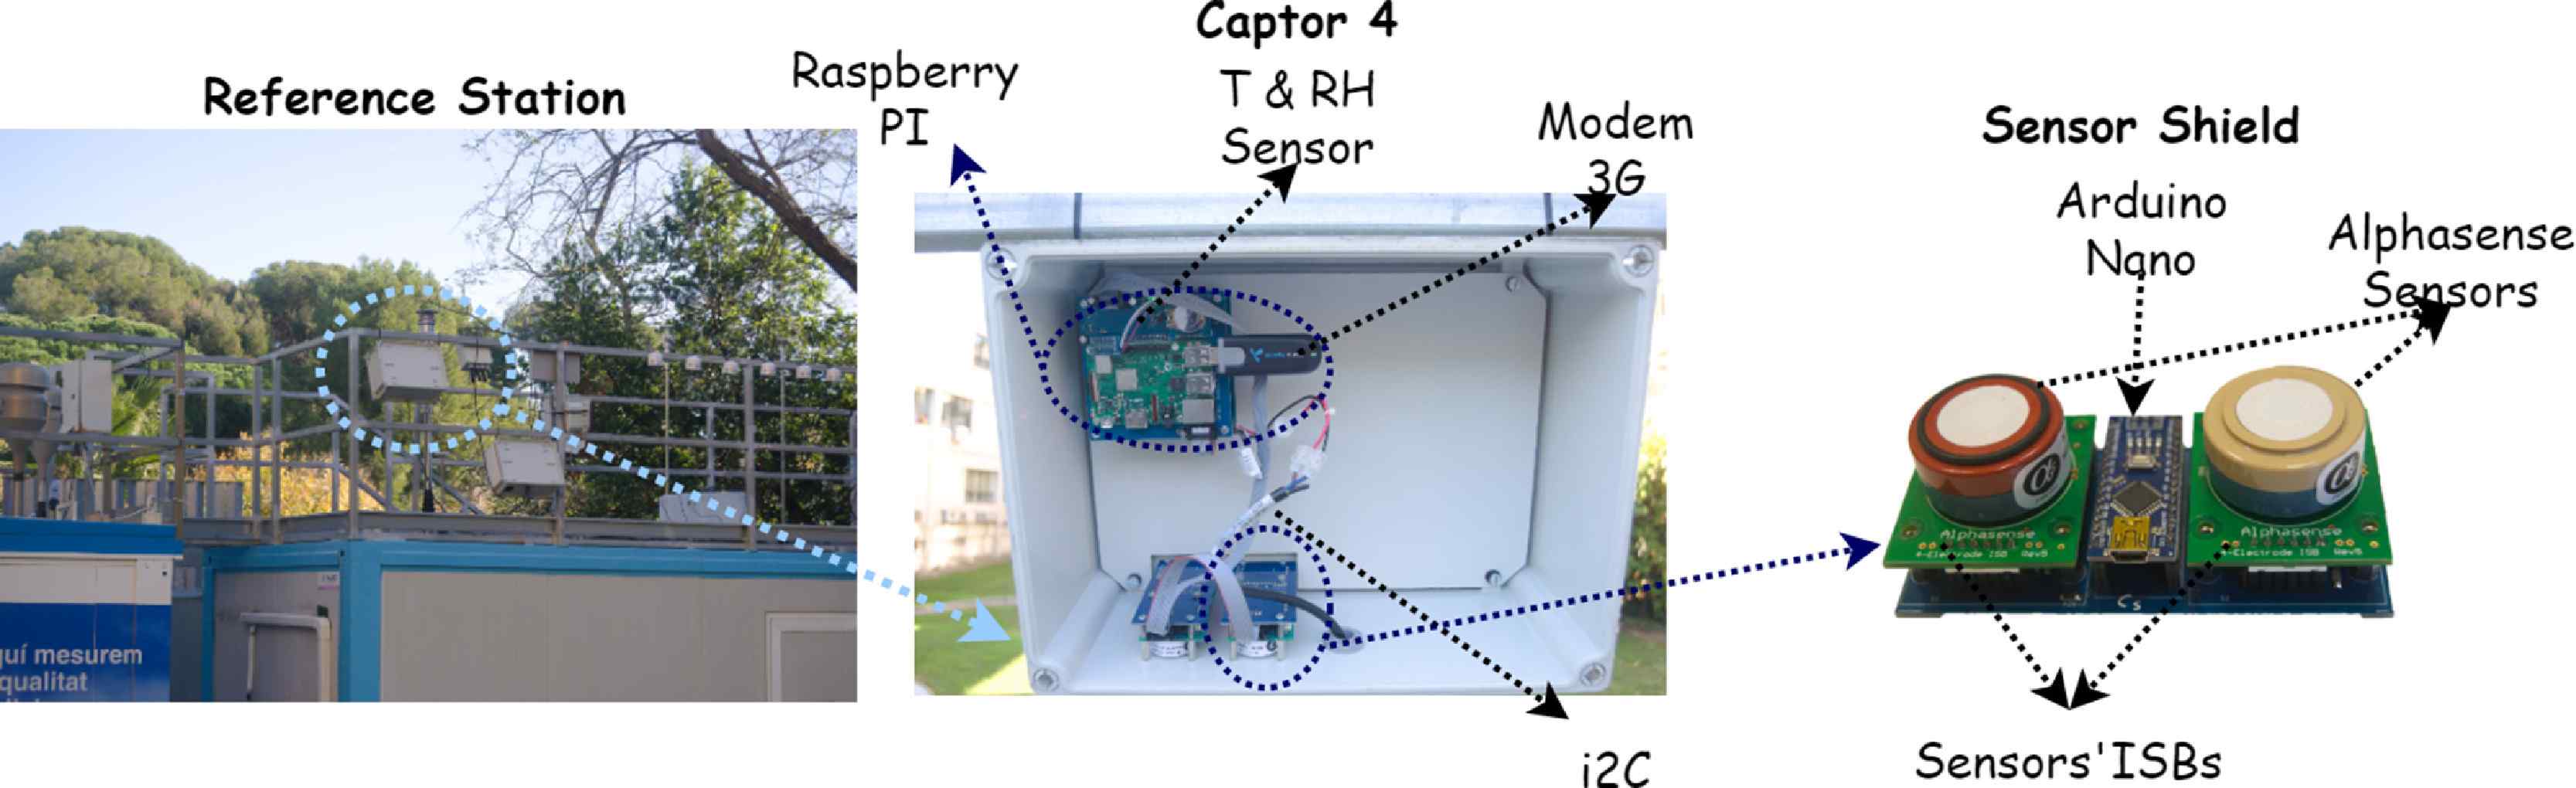
This dataset contains raw signals from two low-cost sensor nodes and ground truth data from reference stations. The sensor nodes contain NO, O3, NO2, temperature, and relative humidity sensors, as described in the original paper publishing the dataset. The reference data contains hourly concentrations of CO, NO, NO2, NOx, O3, and SO2, downloaded from an online database. The goal is to develop a calibration/regression model for the low-cost sensors to accurately predict the target gas concentration for efficient air-quality monitoring.
This analysis will showcase one approach for sensor calibration using Lasso regression. This method differs from generic multiple linear regression (MLR) as it introduces an additional regularization term to control the sparsity of fitting coefficients. By optimizing the regularization strength, we can obtain MLR models with sparse coefficients, leading to better interpretability. This makes Lasso regression naturally suitable for sensor calibration, where simplicity is desired. The performance of Lasso regression is compared with generic MLR to confirm its good performance.
The calibration results indicate that with only two weeks of training data, the calibration quality for four months of NO, NO2, NOx, and O3 data is very good, with R2 scores around and above 0.85. This validates the idea of using low-cost sensor nodes to increase monitoring network density for improved air quality monitoring performance.
The full analysis with code can be found in this Kaggle notebook.
EDA
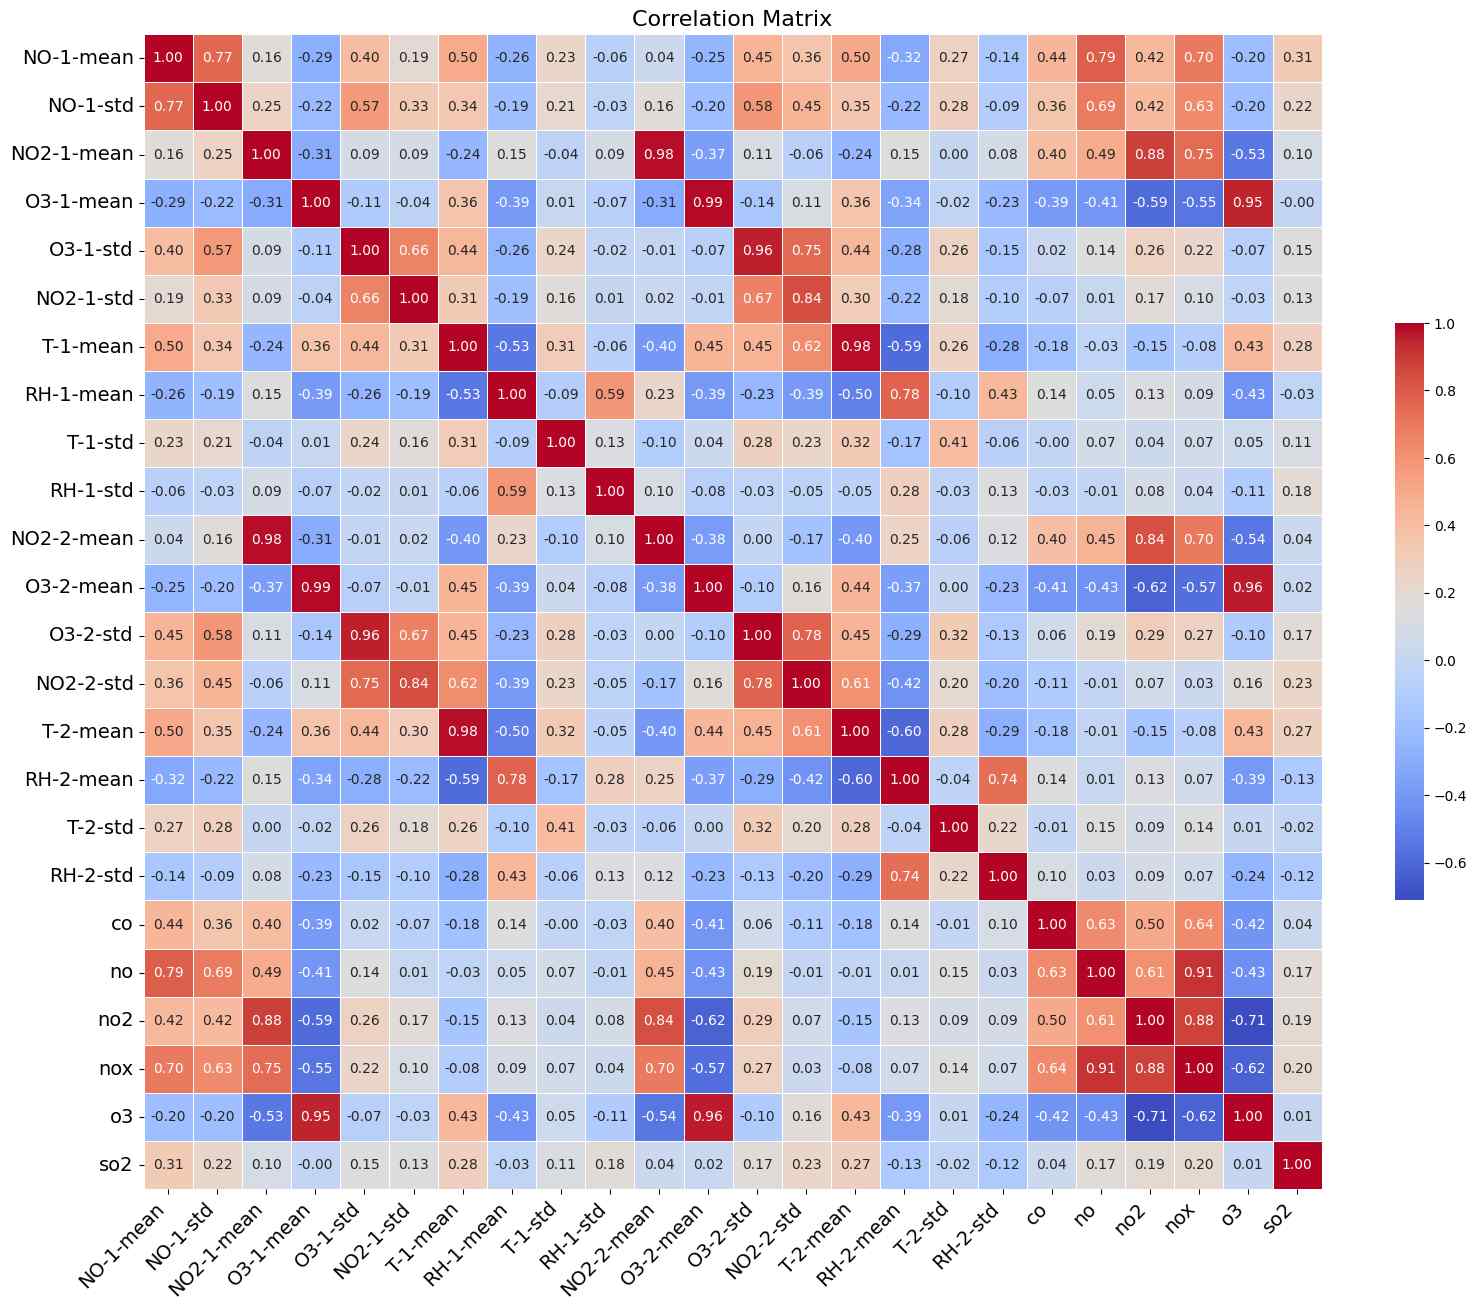
Let’s take a first look at the data using a correlation matrix and scatter matrix for a sanity check, confirming that no weird correlations arise from errors during the data loading phase.
Several things can be observed from the correlation matrix:
- Same sensors from different nodes show good correlation, confirming the reproducibility among sensors from the same manufacturer.
- The target analyte and its corresponding specialized sensor (O3, NO, etc.) have a strong correlation, confirming the selectivity of these dedicated sensors.
- The NO and NOx levels are highly correlated because NOx contains NO. Therefore, the sensor nodes can also be calibrated to estimate the overall NOx level.
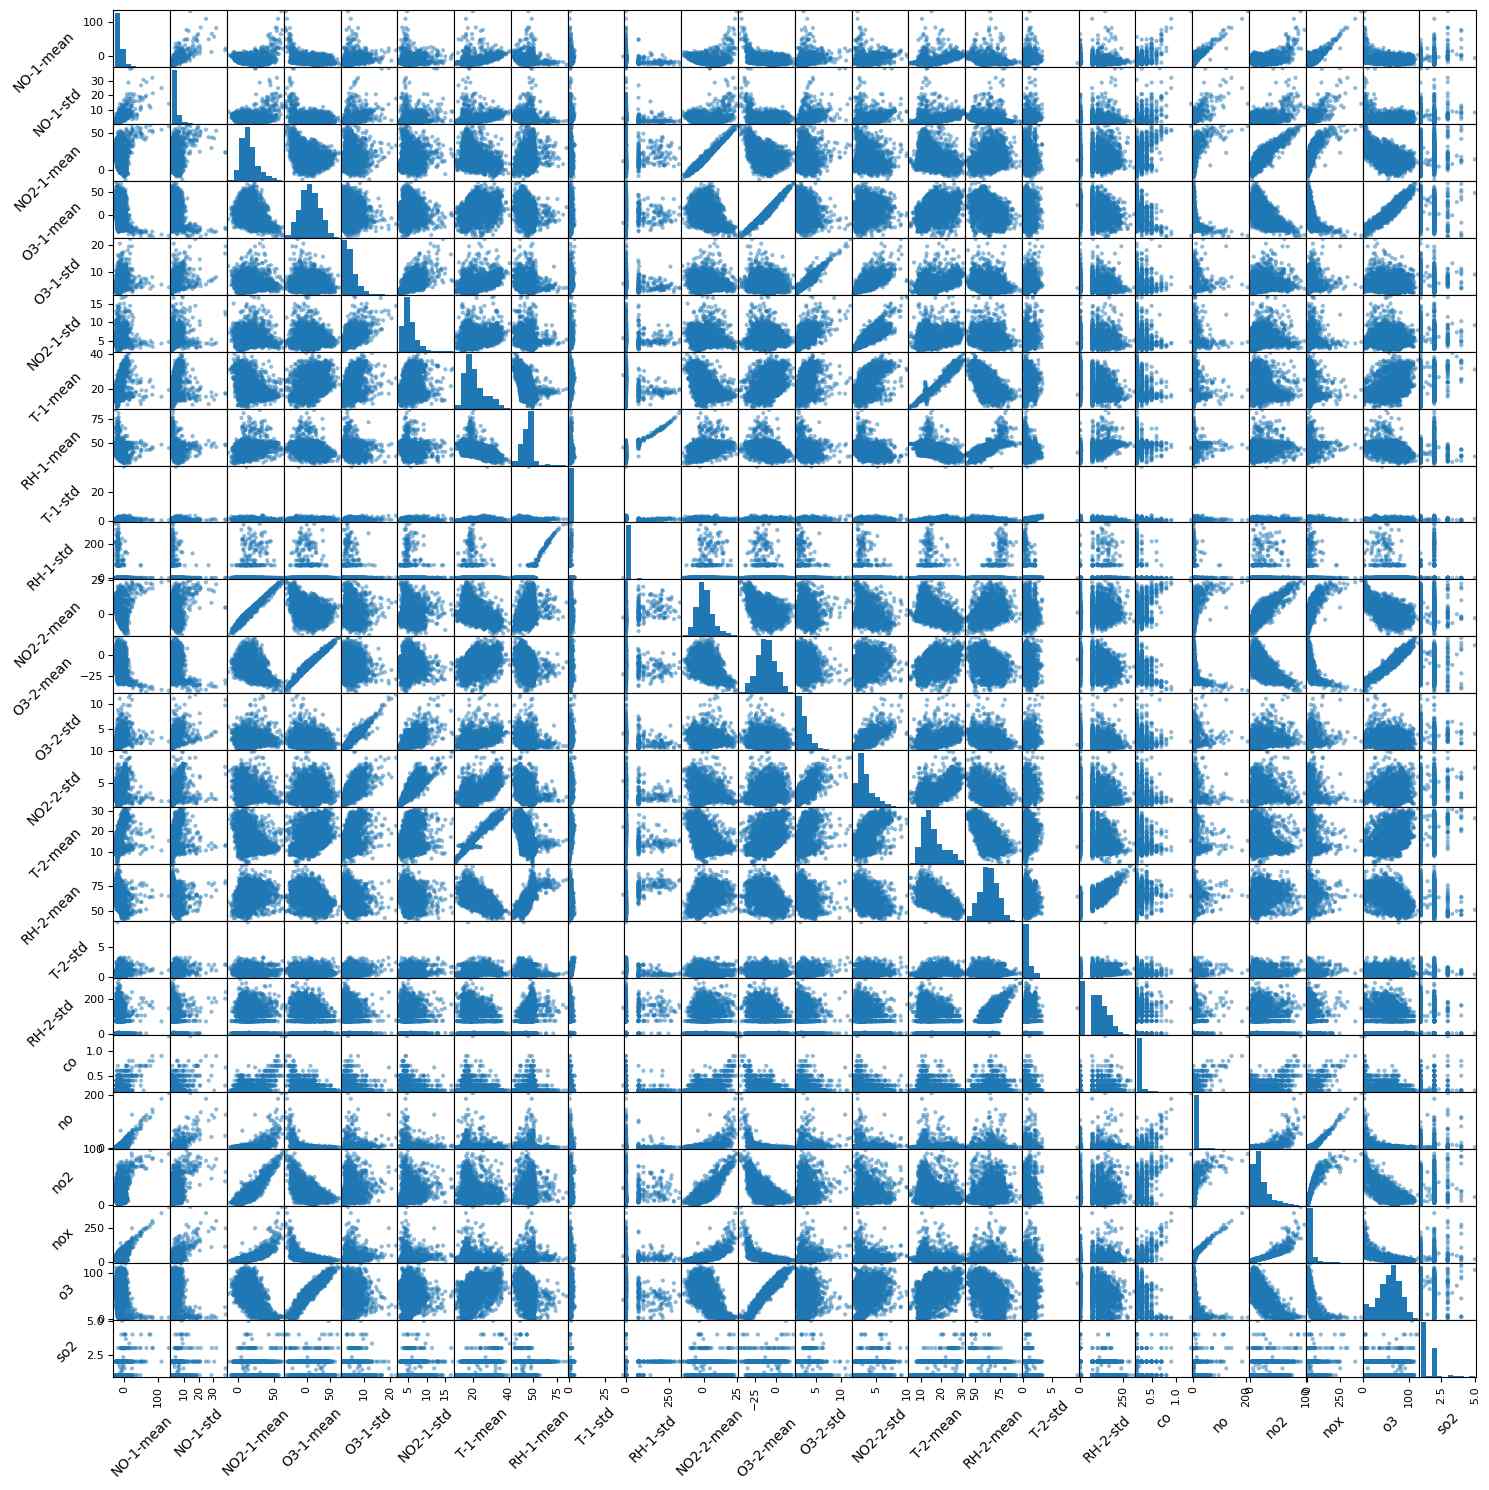
Scatter Matrix
The scatter matrix below provides a more detailed representation of the correlation coefficients presented in the correlation matrix.
Calibration Models
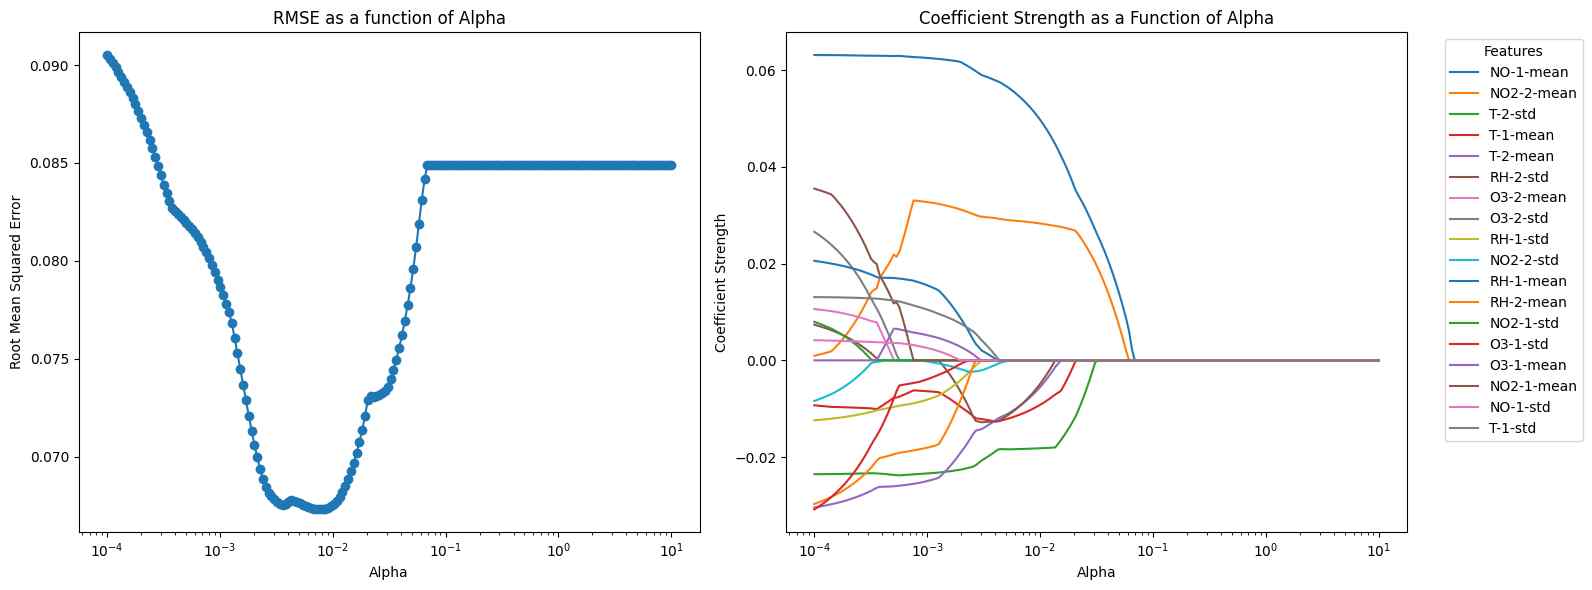
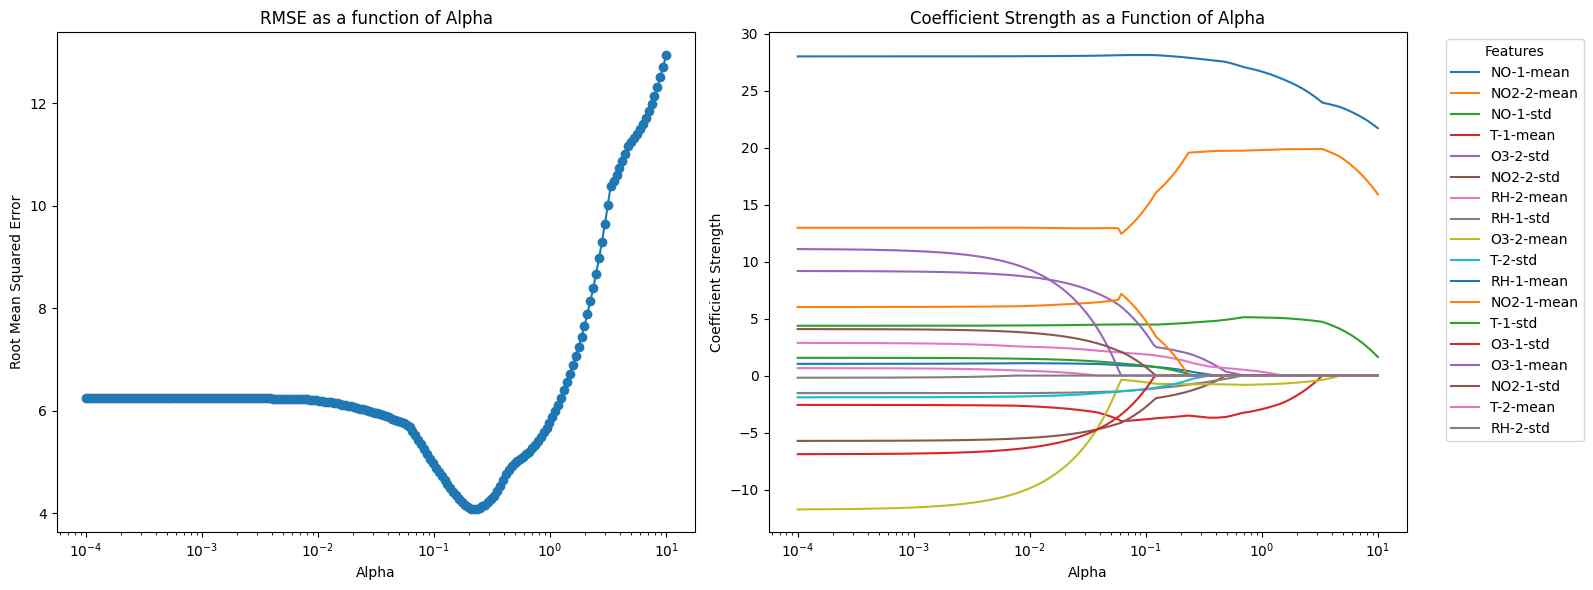
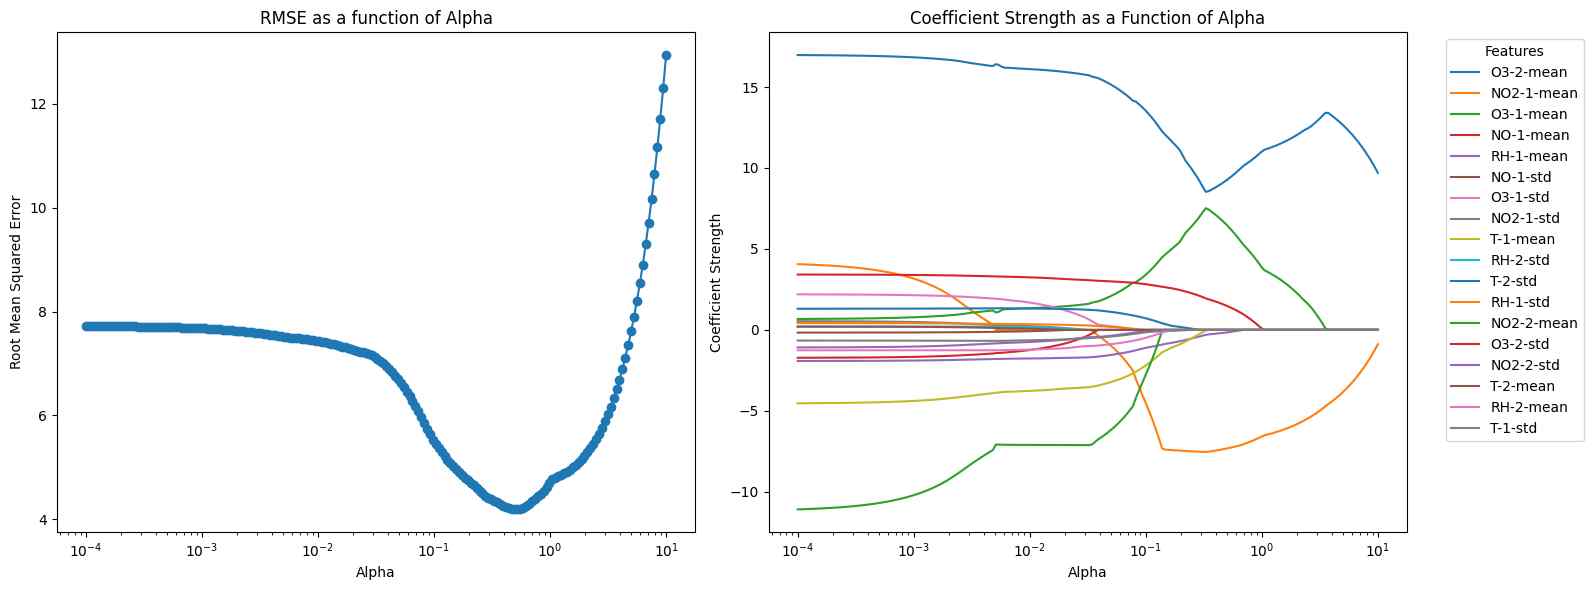
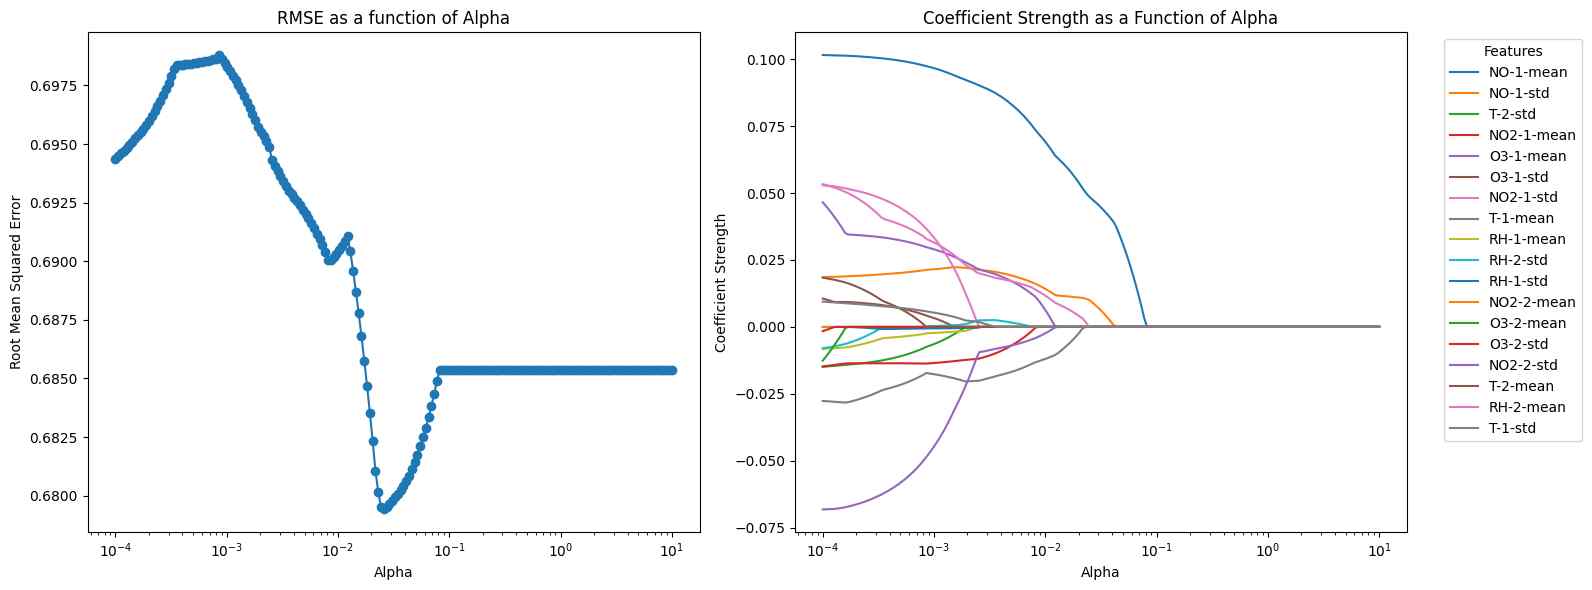
The use of Lasso regression requires the optimization of the regularization term. When the regularization is weak, Lasso regression is reduced to generic multiple linear regression, where all sensor features are used in the regression. When the regularization strength is high, it promotes sparsity and penalizes the use of unimportant features, significantly reducing the number of features required during calibration. We select the best regularization strength that minimizes the root mean square error (RMSE).
CO
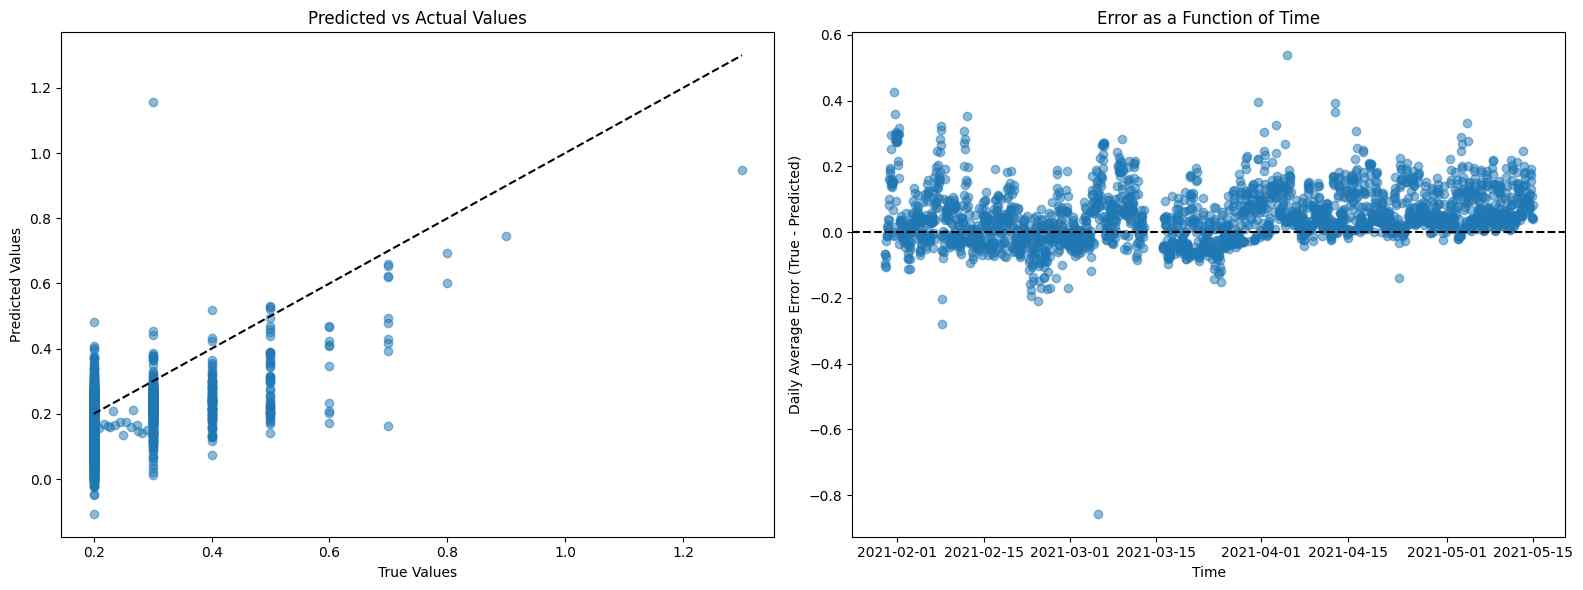
We will start with generic mutliple linear regression for CO concentration calibration. Since there is no CO sensors in the two sensor ndoes, we are expecting a poor calibration performance. MLR yields a R2 score of -0.36, this means that using the signal average can yield a better fit than this calibration model. Moroever, the fit takes all 18 features, making it difficult to interpret the true relationship between CO level and sensor responses.
Root Mean Squared Error (RMSE): 0.09510190232570136
R-square (R2): -0.36544117762102357

Important features in ranked order:
T-2-std: -0.030
T-1-std: 0.026
O3-2-std: 0.024
O3-1-std: -0.014
RH-1-mean: 0.012
NO2-2-std: -0.012
T-2-mean: -0.008
NO2-1-std: 0.006
RH-2-mean: -0.005
NO-1-mean: 0.004
O3-2-mean: 0.004
NO2-1-mean: 0.003
T-1-mean: -0.003
NO2-2-mean: -0.001
O3-1-mean: -0.001
NO-1-std: 0.001
RH-1-std: -0.001
RH-2-std: 0.000
Lasso
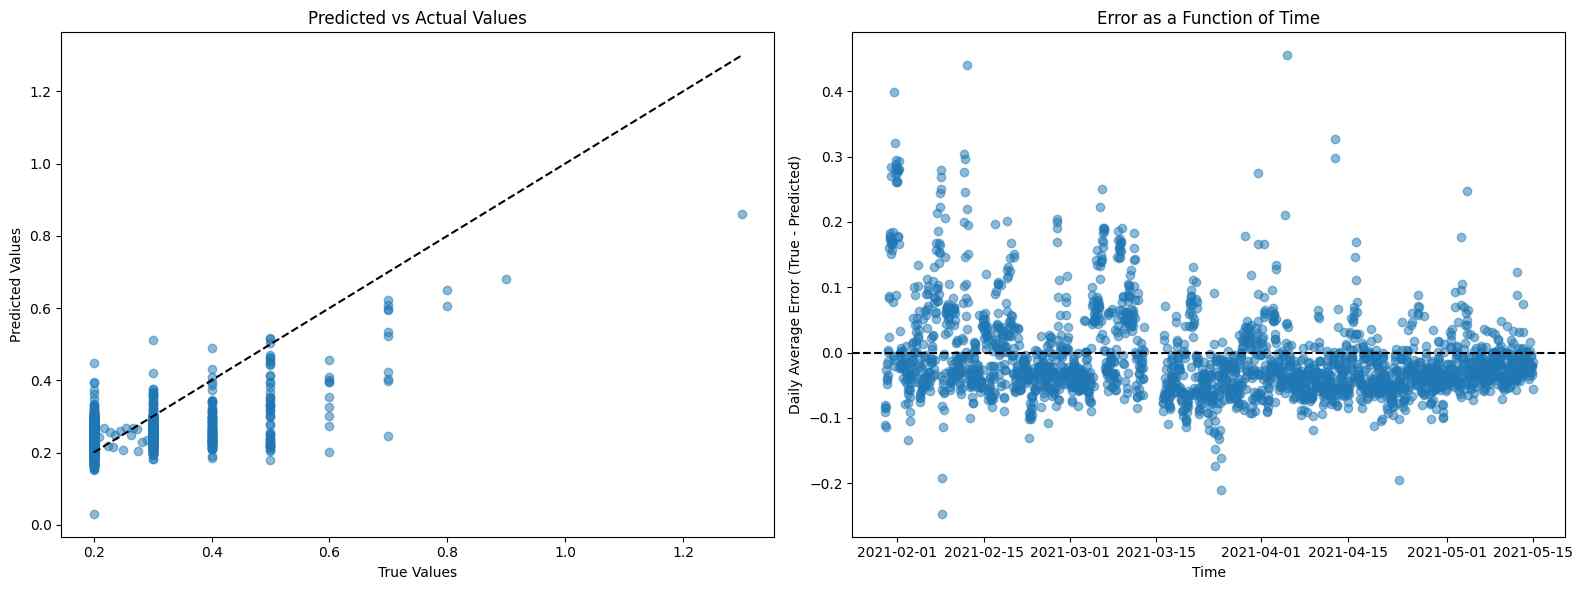
When Lasso is used, it takes a bit of optimization to find the best regularization strength that minimizes RMSE. However, it yields much better results compared to MLR
The calibration for CO using Lasso gives an R2 score of 0.32, which is a poor score in terms of calibration, but it is way better than a negative score. In this fit, only 6 features are used, in contrast to the 18 in MLR. The high importance of the NO sensor indicates that the fitting power arises from the correlation between CO and NO. In other words, information about NO can provide information for CO to some extent.
Best Alpha: 0.007663410868007463
Lowest RMSE: 0.06729859740532539
R-square (R2): 0.3162353989349179

Important features in ranked order:
NO-1-mean: 0.053
NO2-2-mean: 0.029
T-2-std: -0.018
T-1-mean: -0.011
T-2-mean: -0.008
RH-2-std: -0.008
NO
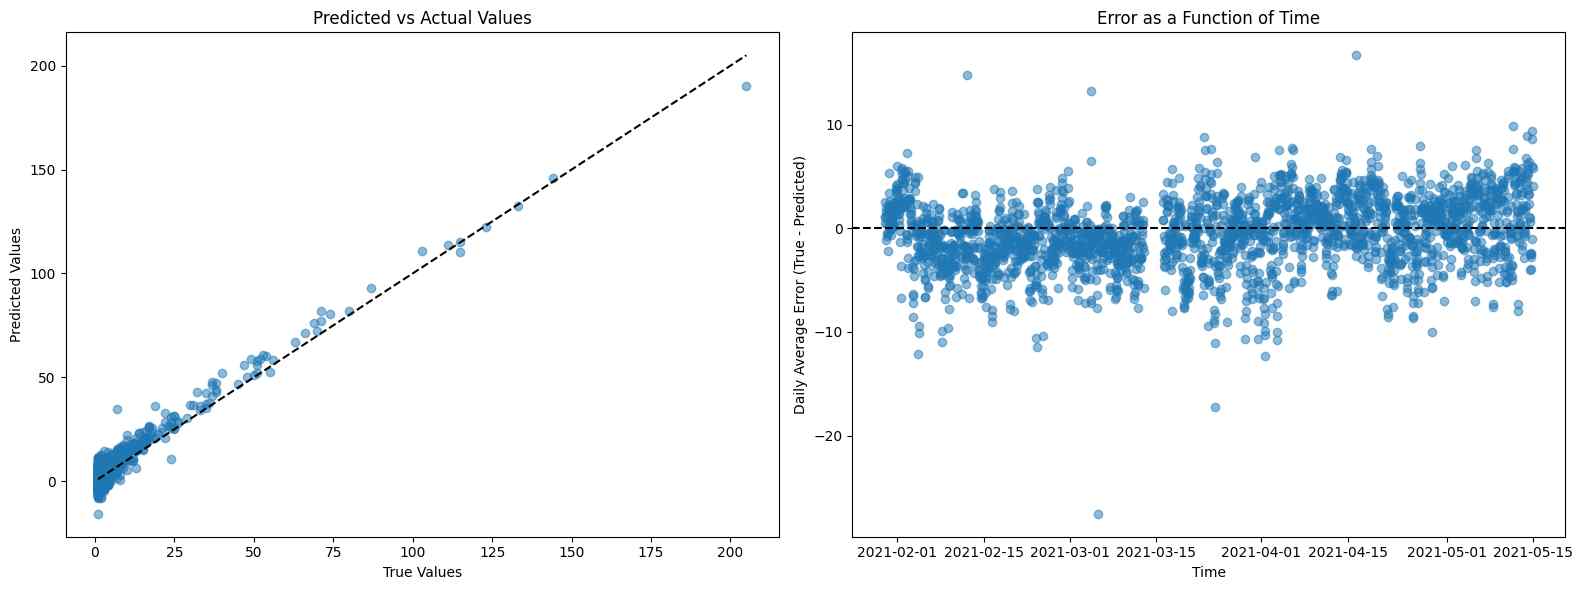
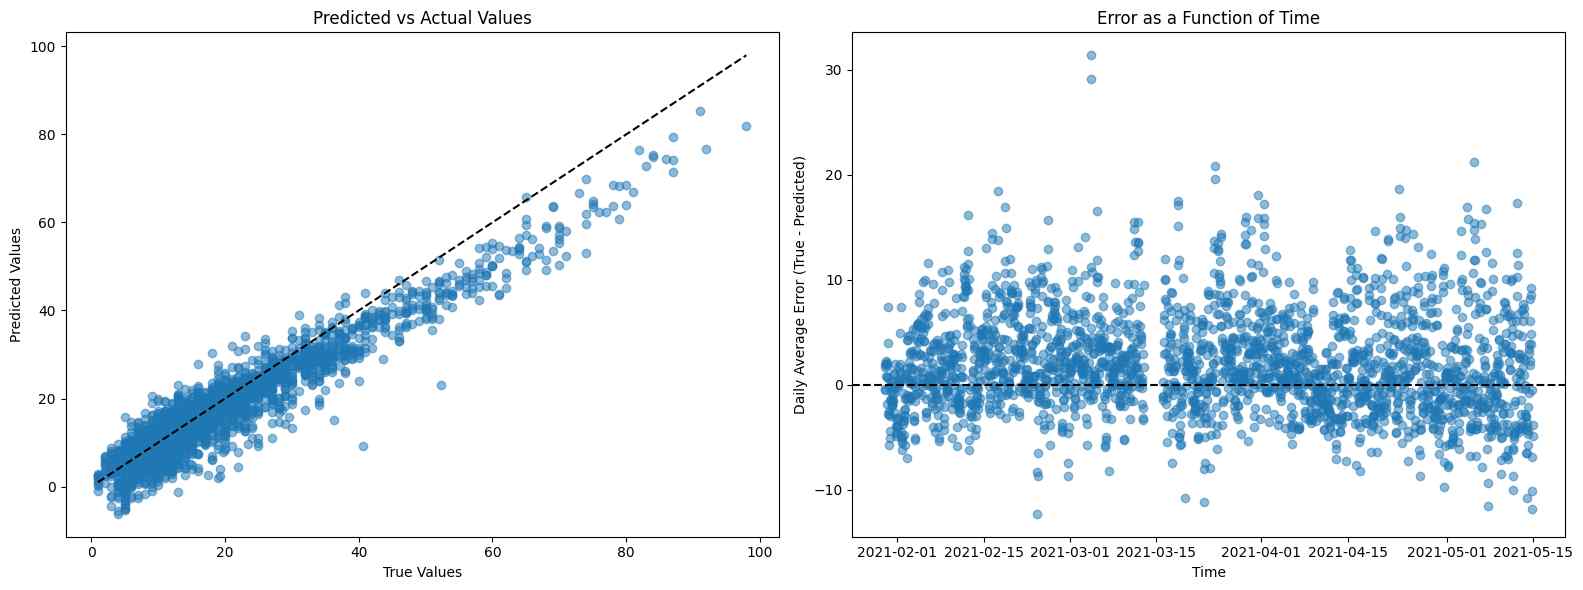
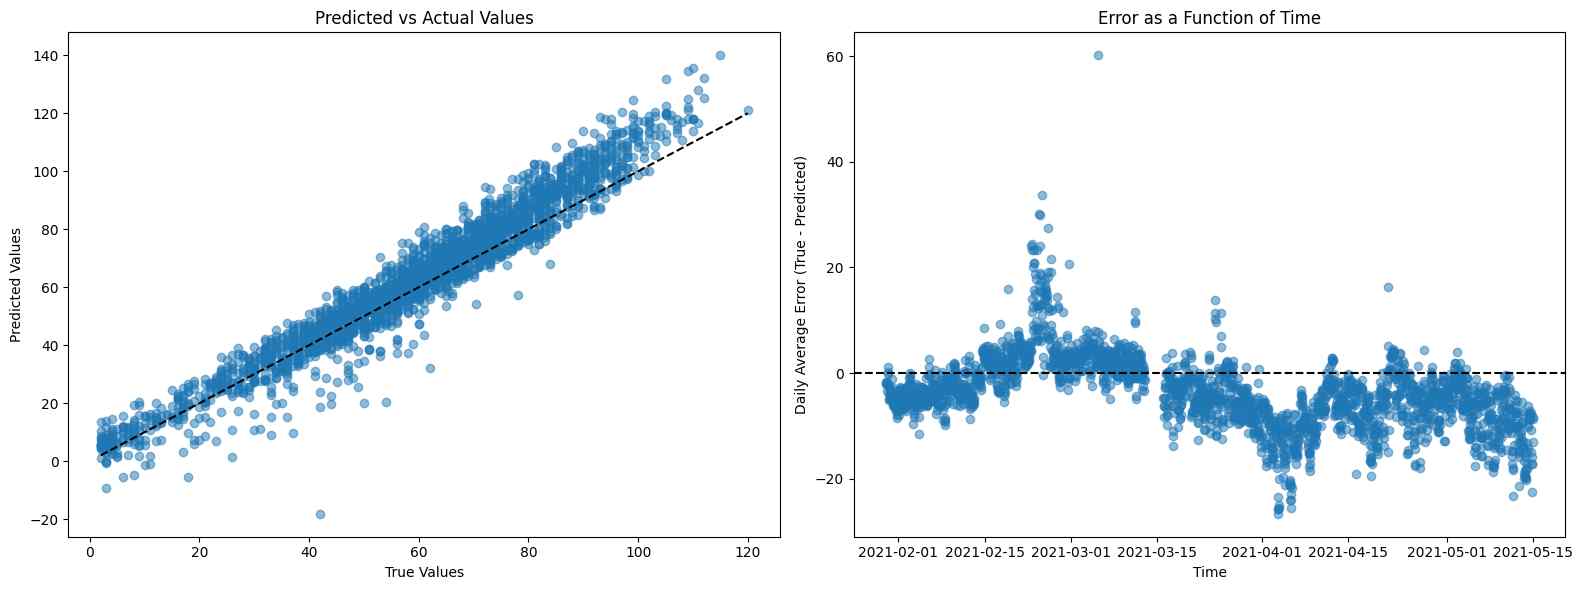
We have a NO sensor in the sensor node, so we expect much better calibration performance for this target. MLR gives an R2 of 0.83, and again with 18 features. In contrast, Lasso gives an R2 score of 0.89 with 14 features.
The coefficient strength in MLR is difficult to interpret, with the standard deviation of NO2 and O3 sensors ranked at the top. While for Lasso, the most important feature is, unsurprisingly, the mean NO sensor signals, which is a much more interpretable result compared to generic MLR.
Root Mean Squared Error (RMSE): 4.2264908237788
R-square (R2): 0.8270971320082721

Important features in ranked order:
NO2-2-std: -4.818
O3-2-std: 3.994
T-2-std: -2.652
T-1-std: 2.082
NO2-1-std: 2.002
O3-1-std: -1.764
O3-2-mean: -1.262
NO-1-mean: 1.193
O3-1-mean: 0.751
NO-1-std: 0.534
T-1-mean: -0.436
RH-2-mean: 0.380
NO2-2-mean: 0.205
RH-1-mean: 0.149
T-2-mean: 0.105
NO2-1-mean: 0.060
RH-1-std: -0.033
RH-2-std: -0.013
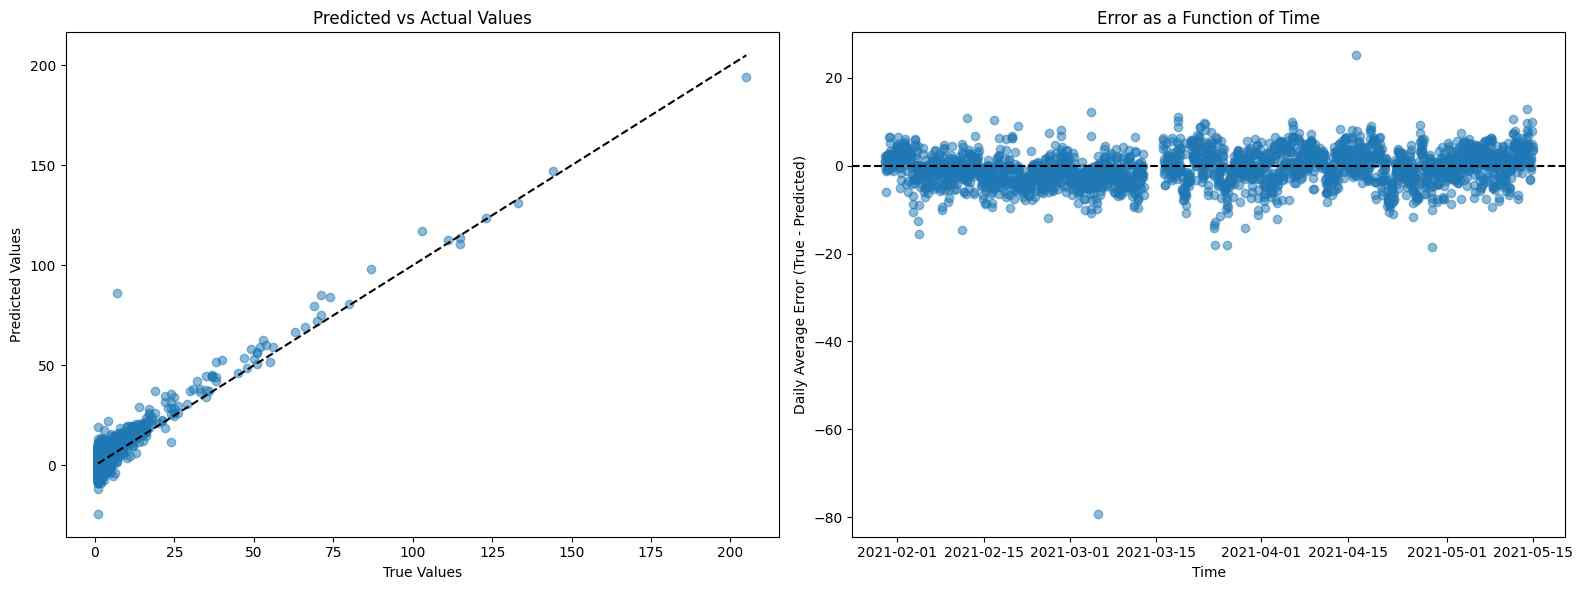
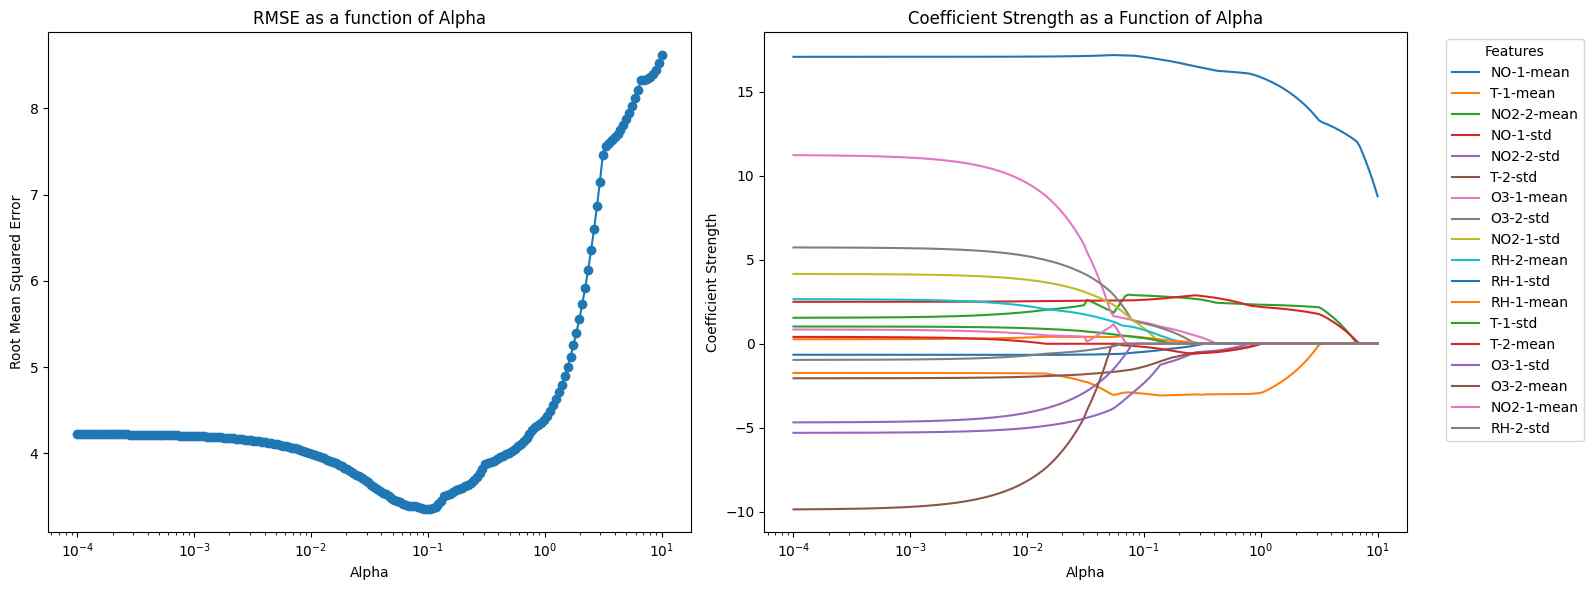
Lasso
Best Alpha: 0.09771241535346502
Lowest RMSE: 3.351793279224709
R-square (R2): 0.8912581323139401

Important features in ranked order:
NO-1-mean: 17.074
T-1-mean: -2.961
NO2-2-mean: 2.873
NO-1-std: 2.613
NO2-2-std: -2.404
T-2-std: -1.379
O3-1-mean: 1.292
O3-2-std: 1.231
NO2-1-std: 0.977
RH-2-mean: 0.845
RH-1-std: -0.486
RH-1-mean: 0.378
T-1-std: 0.345
T-2-mean: -0.180
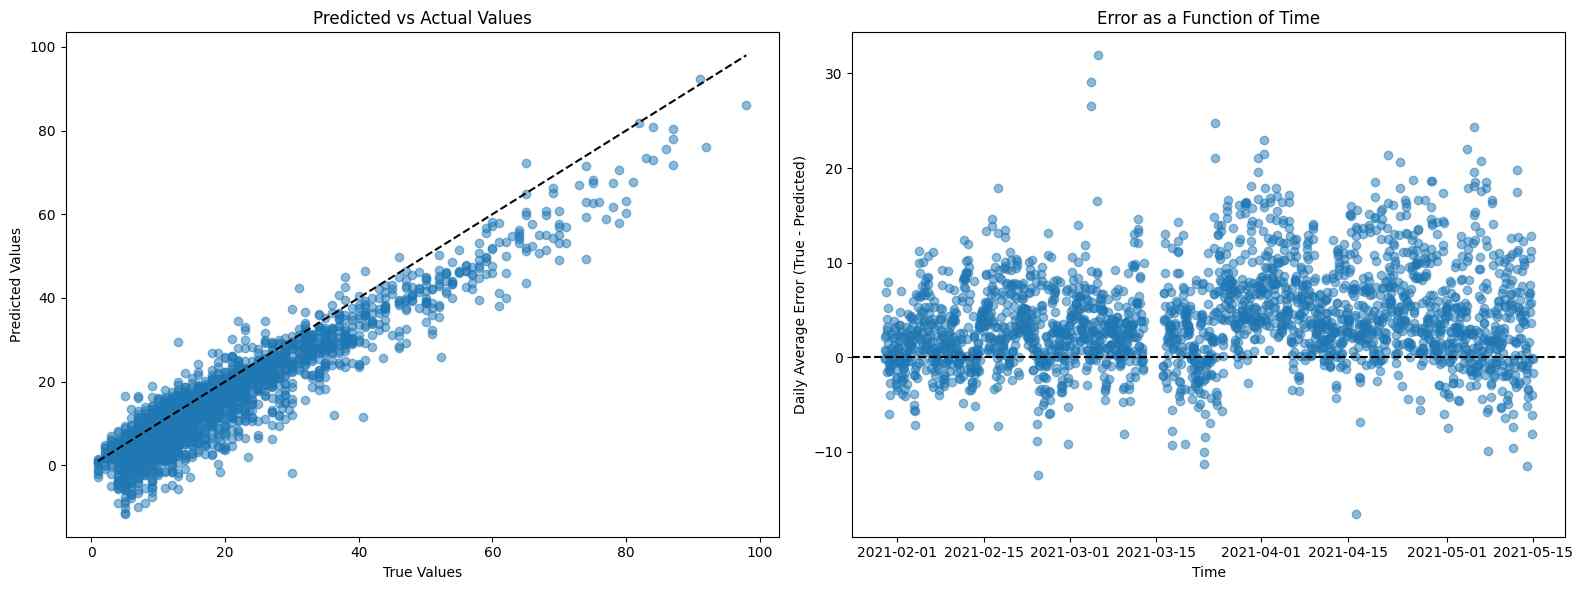
NO2
MLR yields an R2 value of 0.81 using 18 features. On the other hand, Lasso produces an R2 value of 0.88 using only 7 features, while maintaining an interpretable and intuitive feature importance ranking, where the NO2 sensor is ranked as the top feature.
Root Mean Squared Error (RMSE): 6.440397029953247
R-square (R2): 0.8093599915341789

Important features in ranked order:
NO2-2-std: 2.284
T-2-std: 2.238
NO2-2-mean: 1.491
NO2-1-std: -1.202
T-1-std: -0.668
O3-2-mean: 0.499
O3-1-mean: -0.457
O3-2-std: 0.438
RH-1-mean: 0.388
NO2-1-mean: 0.278
RH-2-mean: -0.178
NO-1-mean: 0.129
NO-1-std: 0.095
T-1-mean: -0.053
O3-1-std: 0.045
T-2-mean: 0.044
RH-2-std: 0.015
RH-1-std: -0.013
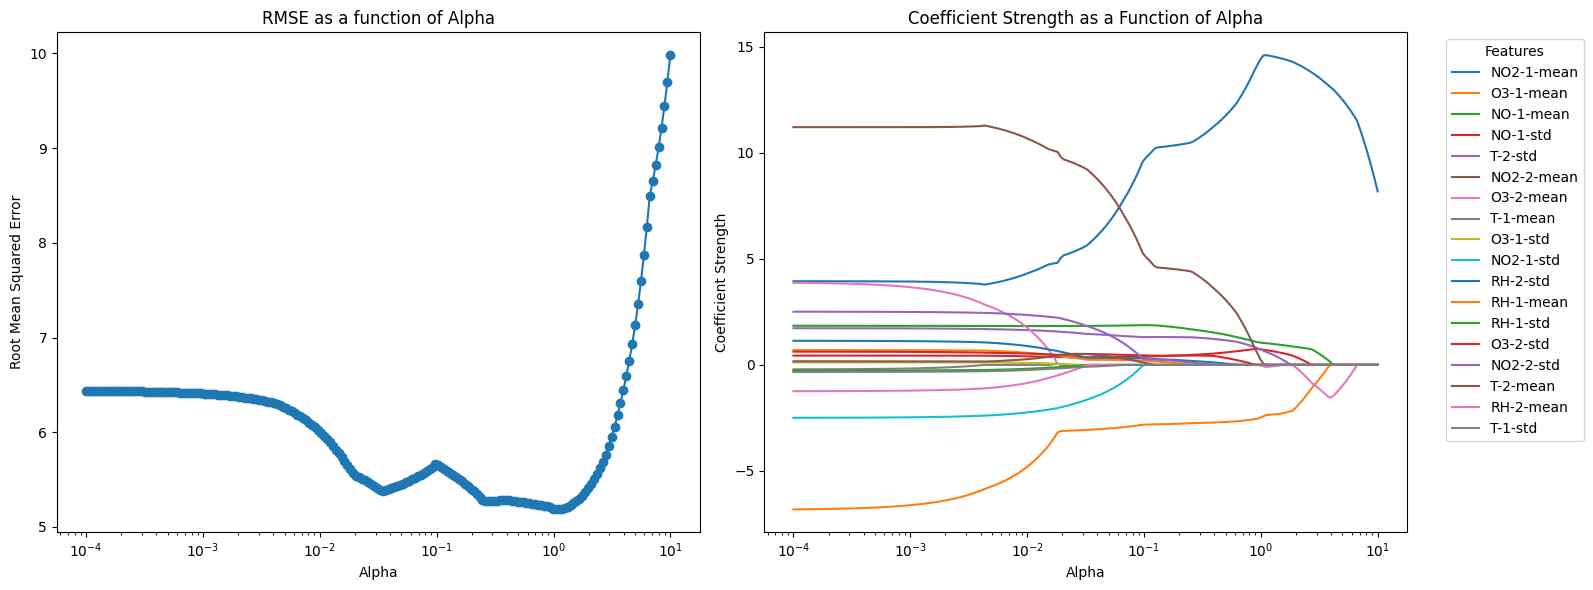
Lasso
Best Alpha: 1.0473708979594507
Lowest RMSE: 5.185303509790579
R-square (R2): 0.876423147284822

Important features in ranked order:
NO2-1-mean: 14.588
O3-1-mean: -2.432
NO-1-mean: 1.037
NO-1-std: 0.720
T-2-std: 0.679
NO2-2-mean: 0.064
O3-2-mean: -0.056
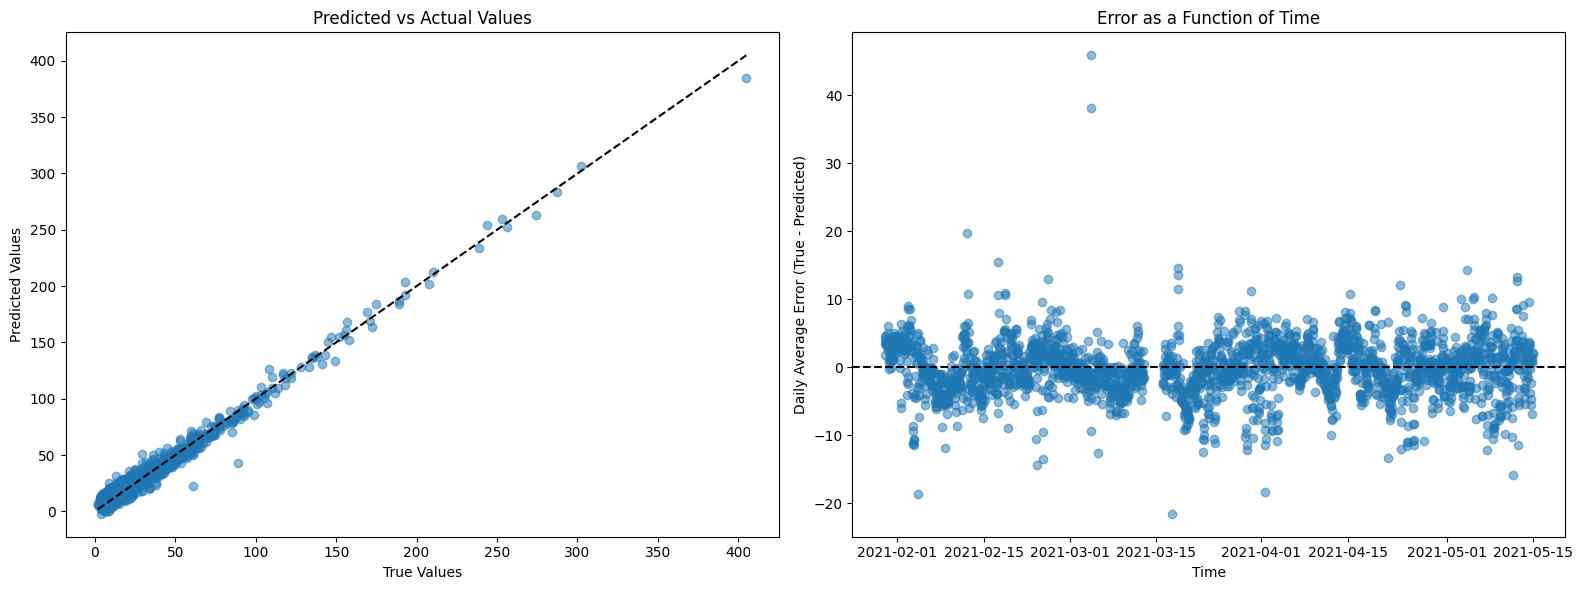
NOx
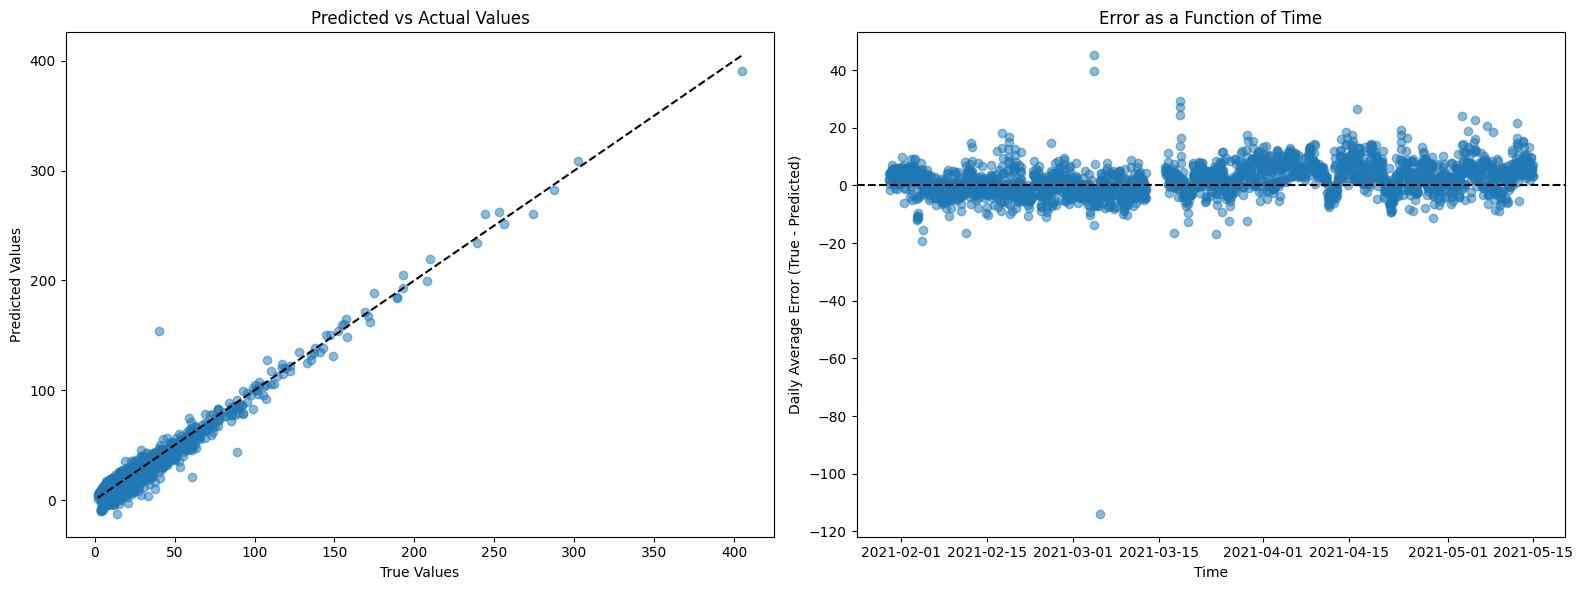
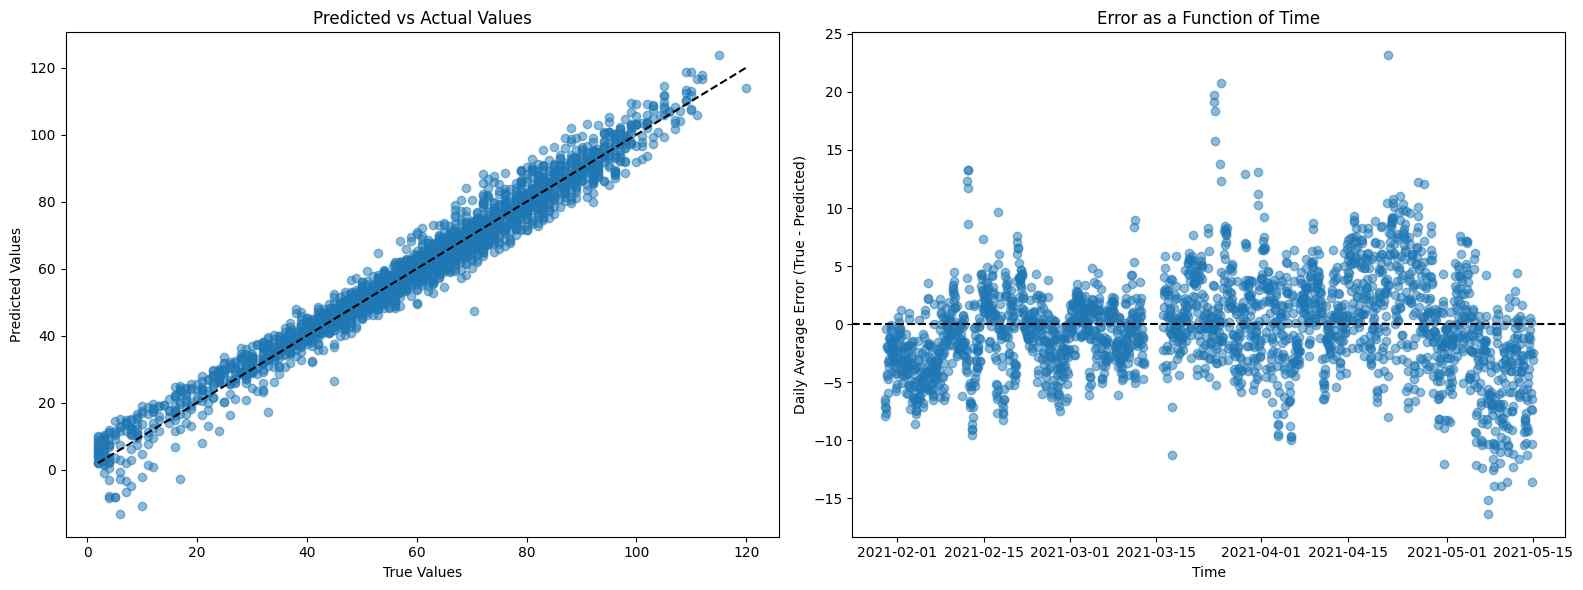
MLR yields an R2 value of 0.94 using 18 features, while Lasso regression yields 0.97 with only 13 features. Both NO and NO2 sensors make significant contributions to the model, which is understandable as NOx includes both NO and NO2.
Root Mean Squared Error (RMSE): 6.254375354001741
R-square (R2): 0.9471629963677434

Important features in ranked order:
O3-2-std: 6.393
NO2-2-std: -5.211
T-1-std: 3.161
O3-1-std: -2.601
T-2-std: -2.463
NO2-1-std: 1.966
NO-1-mean: 1.957
NO2-2-mean: 1.724
O3-2-mean: -1.503
NO-1-std: 0.937
O3-1-mean: 0.743
T-1-mean: -0.646
RH-1-mean: 0.570
NO2-1-mean: 0.424
RH-2-mean: 0.411
T-2-mean: 0.167
RH-1-std: -0.077
RH-2-std: -0.003
Lasso
Best Alpha: 0.2196385372416547
Lowest RMSE: 4.07749877548234
R-square (R2): 0.9775426774815258

Important features in ranked order:
NO-1-mean: 27.923
NO2-2-mean: 19.134
NO-1-std: 4.610
T-1-mean: -3.536
O3-2-std: 2.004
NO2-2-std: -1.461
RH-2-mean: 1.277
RH-1-std: -0.840
O3-2-mean: -0.762
T-2-std: -0.483
RH-1-mean: 0.444
NO2-1-mean: 0.421
T-1-std: 0.212
O3
MLR yields an R2 value of 0.89 using 18 features, while Lasso regression yields 0.97 with only 5 features and O3 sensor is ranked as the top feature.
Root Mean Squared Error (RMSE): 7.72672167952889
R-square (R2): 0.8924033068746766

Important features in ranked order:
O3-2-mean: 2.171
T-2-std: 1.689
NO2-2-mean: -1.486
T-1-std: -1.323
O3-2-std: -1.200
T-1-mean: -1.142
RH-1-mean: -1.066
NO2-2-std: -0.987
O3-1-std: 0.831
NO2-1-mean: 0.293
NO2-1-std: 0.264
NO-1-mean: 0.239
RH-2-mean: -0.180
T-2-mean: 0.054
O3-1-mean: 0.044
NO-1-std: -0.036
RH-1-std: 0.021
RH-2-std: 0.003
Lasso
Best Alpha: 0.5231099308056264
Lowest RMSE: 4.189159009206892
R-square (R2): 0.9683727030249096

Important features in ranked order:
O3-2-mean: 9.368
NO2-1-mean: -7.288
O3-1-mean: 6.325
NO-1-mean: 1.425
RH-1-mean: -0.133
SO2
Another sanity check, aside from CO, is to confirm that the good fit for NO, NO2, NOx, and O3 is a result of the dedicated sensors in the sensor nodes. Not all analytes can be calibrated. In the calibration for SO2, MLR gives an R2 of -0.56, and Lasso gives -0.51 with only two features. Even in this difficult situation where nothing is useful, Lasso still outperforms MLR.
Root Mean Squared Error (RMSE): 0.6903626411439422
R-square (R2): -0.5630798996908482

Important features in ranked order:
NO2-2-std: -0.060
NO2-1-std: 0.025
T-2-std: -0.020
T-1-std: 0.019
RH-2-mean: 0.008
NO2-2-mean: 0.008
NO-1-mean: 0.007
O3-1-std: 0.006
NO2-1-mean: -0.005
T-2-mean: 0.005
O3-2-mean: -0.005
O3-1-mean: 0.005
RH-1-mean: -0.005
T-1-mean: -0.005
O3-2-std: -0.004
NO-1-std: 0.004
RH-2-std: -0.000
RH-1-std: 0.000
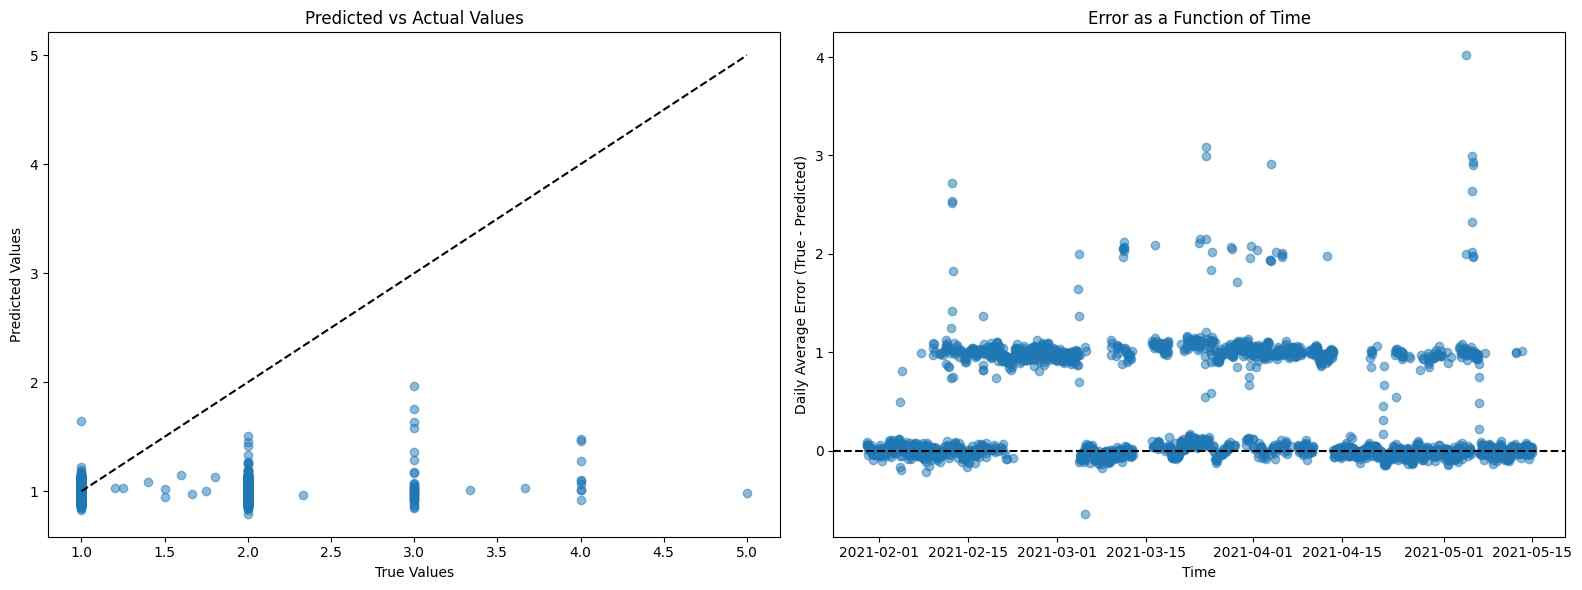
Lasso
Best Alpha: 0.025826187606826773
Lowest RMSE: 0.6794162572743656
R-square (R2): -0.5139045155954158

Important features in ranked order:
NO-1-mean: 0.048
NO-1-std: 0.010
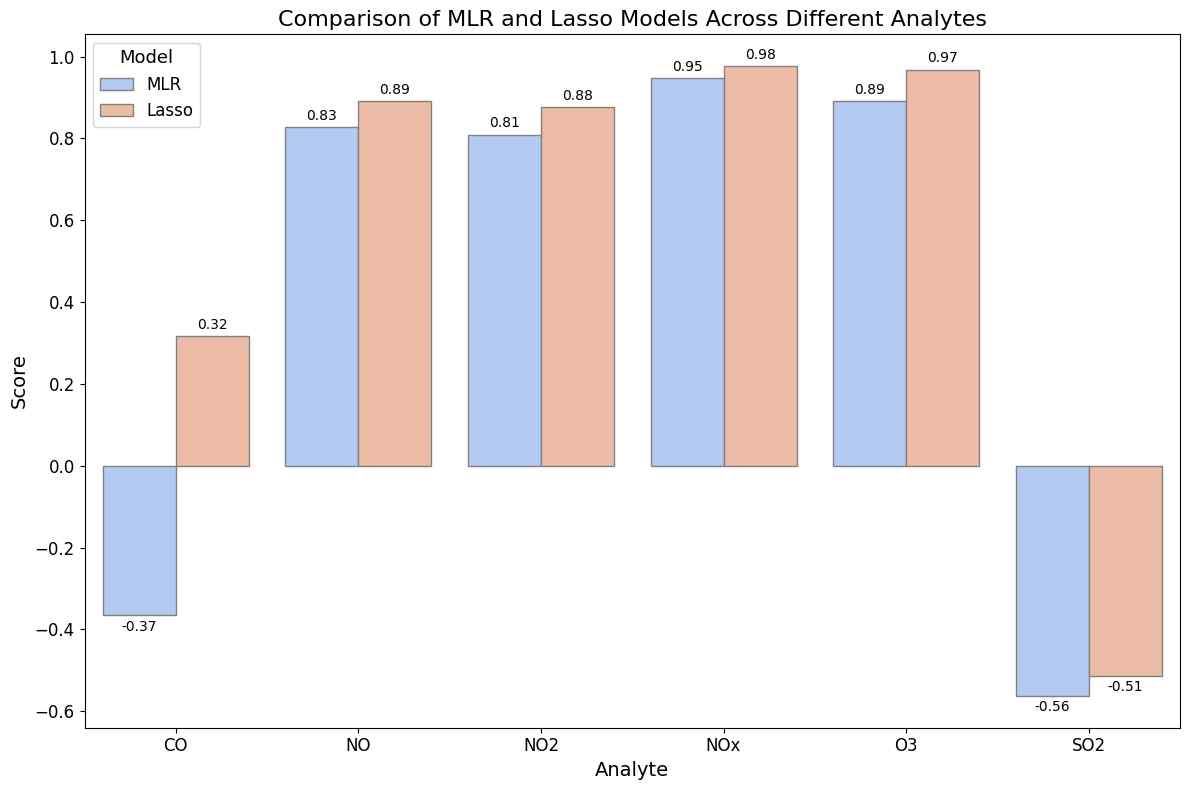
Summary
Here is a brief summary on the model performance between generic MLR and Lasso. Lasso consistently produces better models with high R2 score and good interpretability.
Conclusions
Using the first two weeks of data for training and the following four months of data for validation, we show that Lasso regression can yield excellent sensor calibration for several air quality markers, including NO, NO2, NOx, and O3. The R2 scores for all these analytes are around and above 0.85, indicating good sensor stability over time. Compared with generic MLR, Lasso regression provides a much better calibration performance and better model interpretability.
In conclusion, Lasso regression provides a middle ground between overly simplistic multiple linear regression and uninterpretable machine learning models. Its ability to generate a sparse calibration relationship offers an efficient alternative to conventional calibration methods for low-cost air quality monitoring sensor arrays.