Decoding Customer Behavior in Shopping Malls with Time Series Data Analysis
This post presents a comprehensive data analysis of customer traffic in shopping malls. It explores how customers move, interact, and congregate in different areas within a mall, providing valuable insights for optimizing mall layout for traffic control and strategic advertising.
Analysis Goal
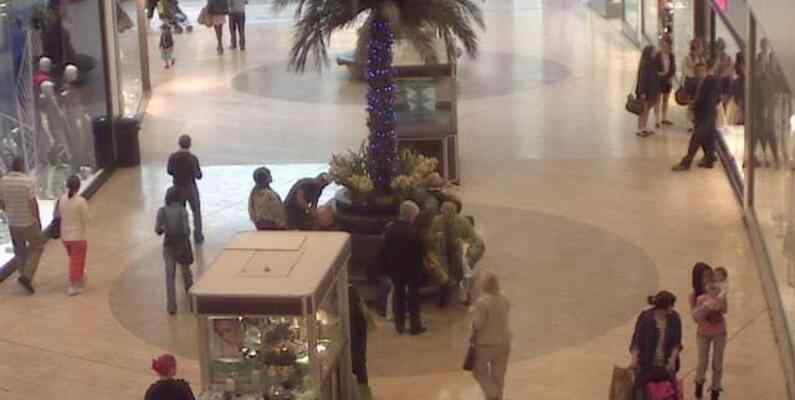
This dataset comprises head annotations of individuals captured in a mall over 2000 frames by a surveillance camera. This dataset is originally intended for crowd counting problem, which I have another notebook on this topic: Crowd Counting via Density Map.
The more I worked on it, the more I noticed the fascinating sub-structure within this dataset. Here, we adopt a perspective of time series analysis, where individuals entering the scene randomly, and their collective behaviors are observed from a statistical standpoint.
The analysis will start with basic temporal features of the total head count. We observe that the patterns of people entering or exiting the scene align with classical stochastic processes, characterized by a stationary time series and an exponential distribution of time intervals between successive entry and exit events. This suggests that the flow of people in and out of the mall occurs in a random and independent manner.
To visualize the collective patterns of customers, we generate a heatmap showing frequent congregation areas and outlining the self-similar hierarchical sub-structures within the mall. Specifically, we will find unique spatial and temporal patterns in regions like the food stand and the benches, where people behave significantly different from those walking down the hallway. By analyzing these areas, we identify typical time scale of aggregation and the associated cluster size, potentially offering a statistical pathway for commercial performance evaluatoin and mall layout optimization for traffic control and strategic advertising.
The full analysis with code can be found in this Kaggle notebook.
The Mall as a Whole
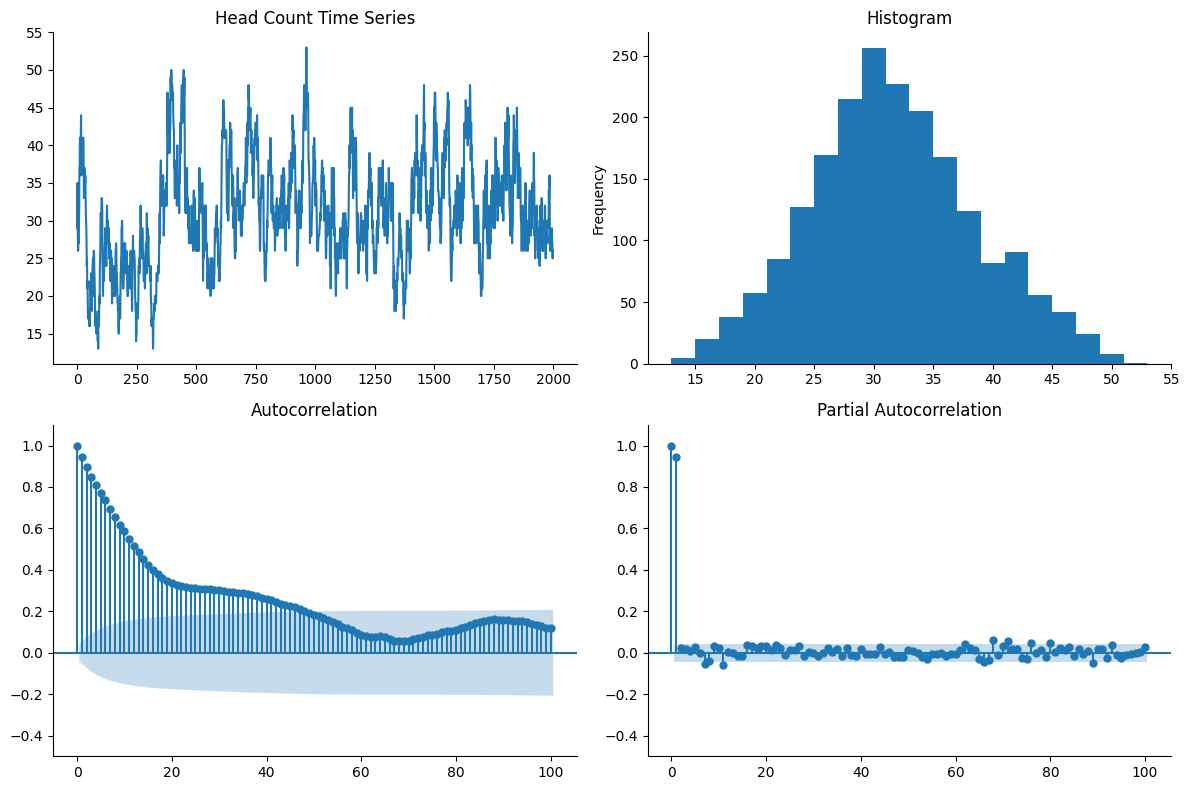
Time series analysis on the number of people in each frame reveals that it has a rough Gaussian distribution. The autocorrelation plot reveals that the head count in one frame correlates with counts up to 40 frames prior. This temporal correlation is intuitive as it takes time for an individual to exit the scene after entering.
First Differencing
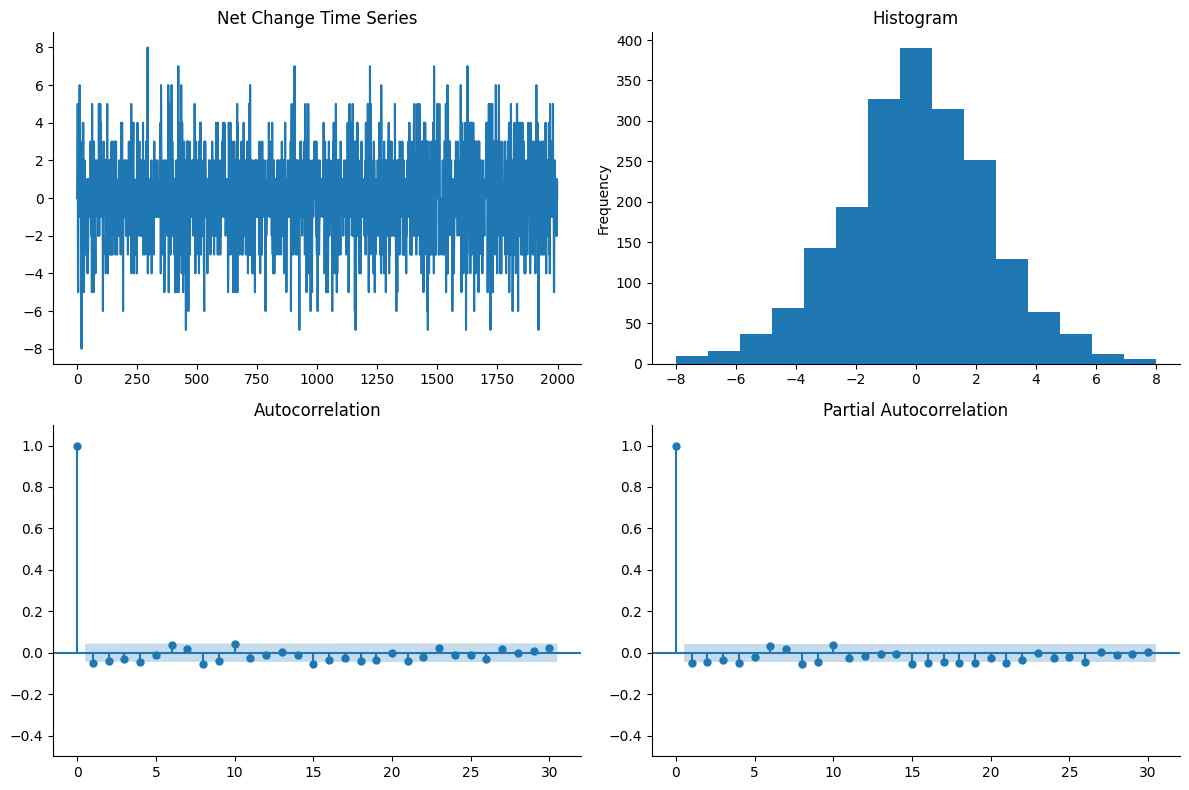
Differencing the head count time series yields the net change between consecutive frames. This series can have positive (people entering) and negative values (exiting), and it more closely approximates a Gaussian distribution. It lacks temporal correlation with preceding frames from the autocorrelation plot, implying that the movement of people in and out of the scene is random and independent of previous frames.
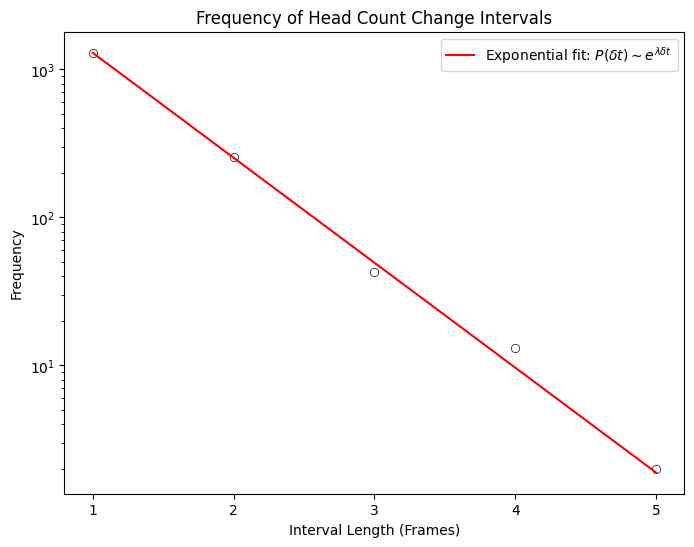
Exponential Distribution
The time intervals between successive entries or exits follow an exponential distribution, indicating the stochastic nature of events and there is no memory linkage between them, that is, people’s movements can be modeled as a random walk, similar to basketball scoring.
Self-Similar Hierachy
Although the mall has random and discrete inflow/outflow as a whole, there exists non-trivial spatial structure within the scene, specfically, benches where people rest and a food stand that attracts people with free samples.
Stationary Analysis - A Heatmap
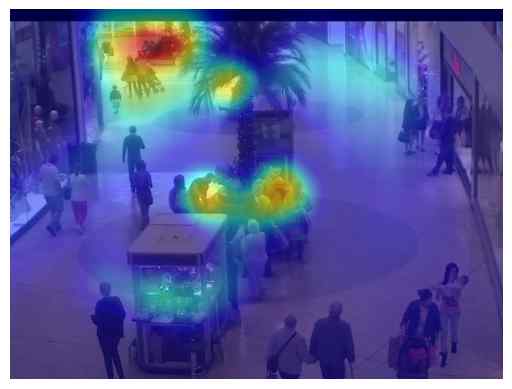
In a commercial context, identifying popular congregation spots is crucial for optimal store and advertisement placement. By integrating density maps across 2000 frames, we obtain an accumulated heatmap indicating the aggregation of people.
Video Output
Here we generate a video that overlays head annotations and the accumulated activity heatmap onto the original frames, providing a dynamic visualization of the findings. The full version of the generated video is uploaded to YouTube.
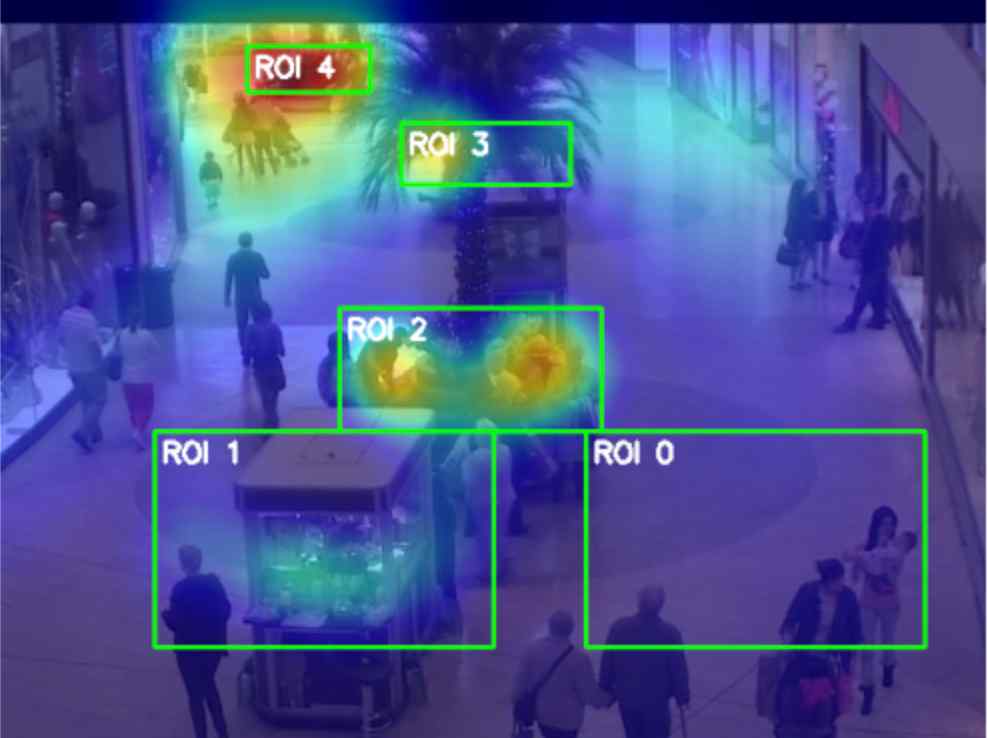
Defining Region of Interest (ROI)
To have a detailed analysis on these hot spots, we define five ROIs: a reference are (ROI 0), a food stand (ROI 1), and three benches where people tend to stay a long time (ROI 2-4).
Dynamic Analysis
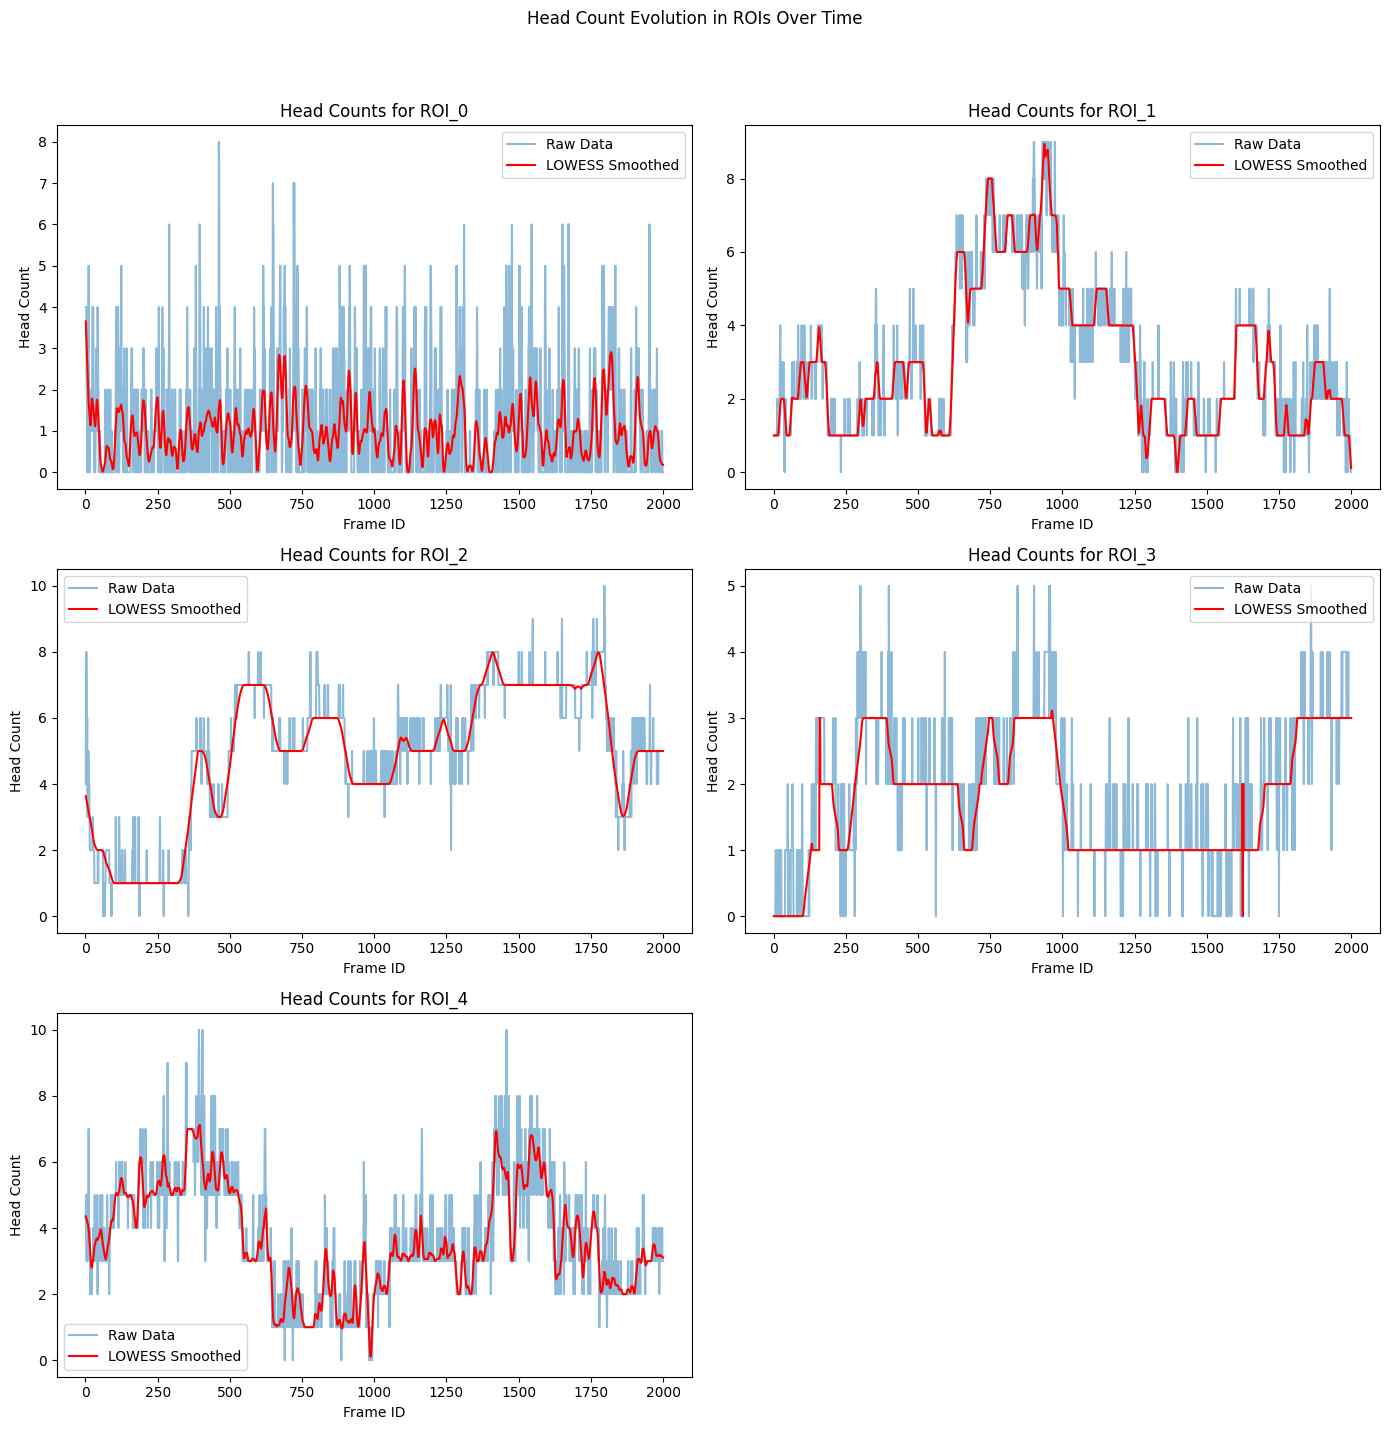
After defining the ROIs, we analyze the number of people within each region over time as time series data. Since the head counts are discrete, we apply a locally weighted scatterplot smoothing (LOWESS) smoothing on the data to filter out random people passing the region, leaving only people that actually stay in the region.
- ROI 0: As expected, this region is like a pipe where people simply flow in and flow out with no head count accumulating.
- ROI 1: The head counts around the food stand exhibit discrete steps, with people passing through the scene as random noise. This region exhibits people building up and clustering behaviors.
- ROI 2-4: For the three benches, they exhibit similar temporal behaviors to that in the food stand with people building up over time. Note that ROI 4 is further away from the camera, therefore, it is significantly noisier than the other two, which is because it locates in the background with a high density of people walking by, obsucring the actual count. By adjusting the smoothing coefficient, we can get a reasonable idea of the dynamics of people building up in this region.
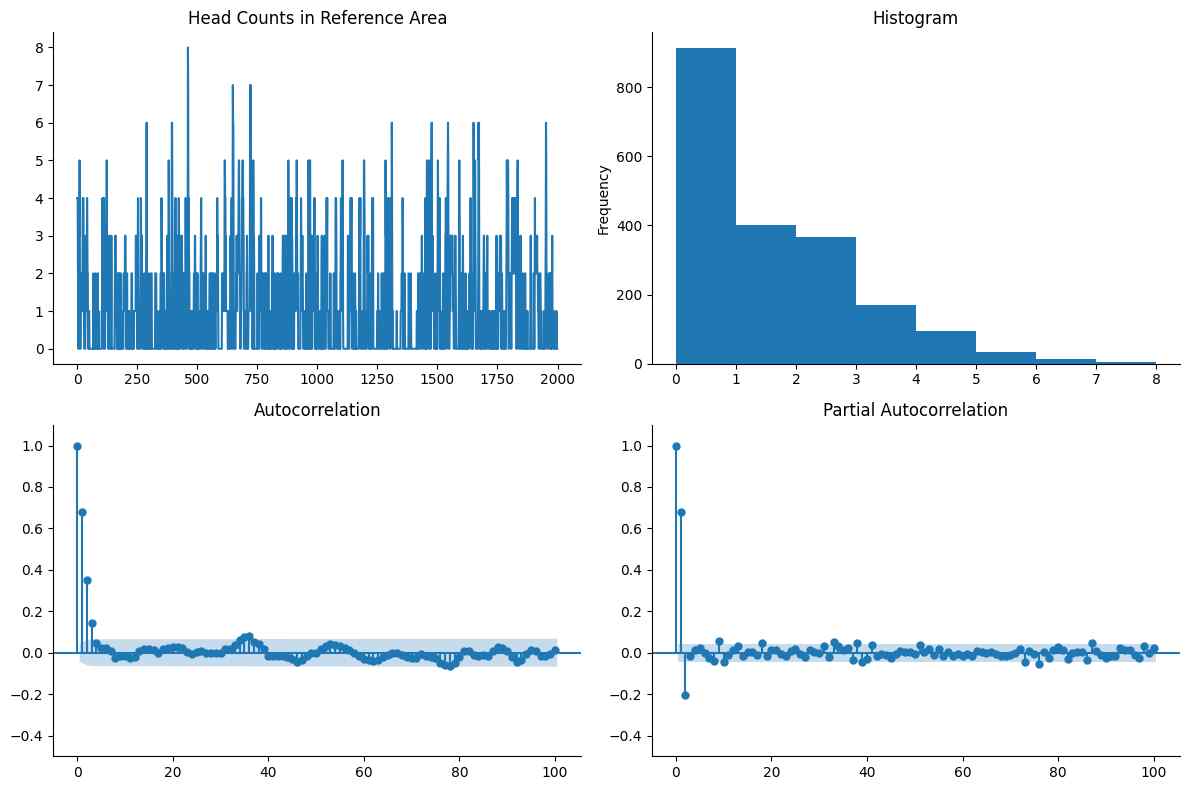
ROI 0 (Reference Area - Hallway)
A closer look at the reference area (ROI 0) reveals that the head count distribution is a familiar exponential distribution. It has temporal correlation only over several frame, indicating people do not tend to stay in this region.
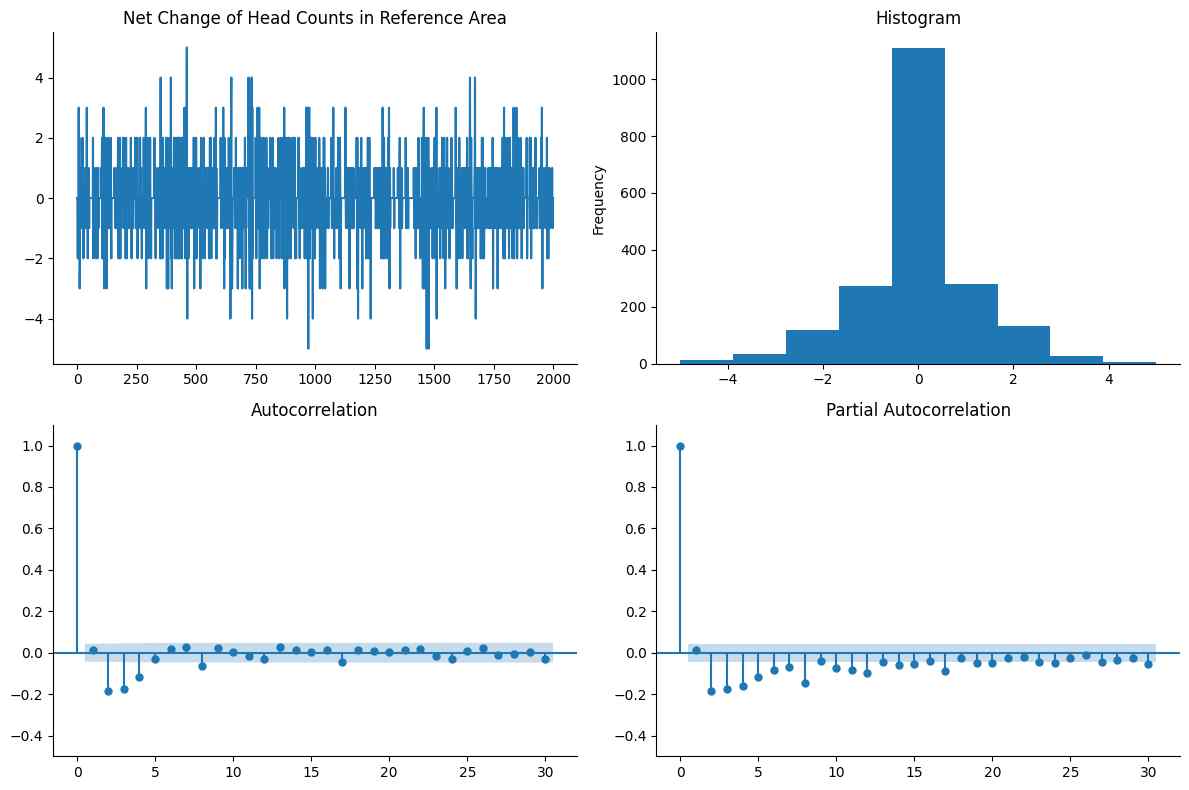
First Differencing
The net change in ROI 0 is a Gaussian distribution, implying the randomness and the independent nature of people flow. Note that the net change has significant negative autocorrelation components, which probably is a result of the small sample size and the discrete nature of head count. The negative component is ubiquitous in data from all ROIs. If the ROIs are large enough, these negative components should vanish.
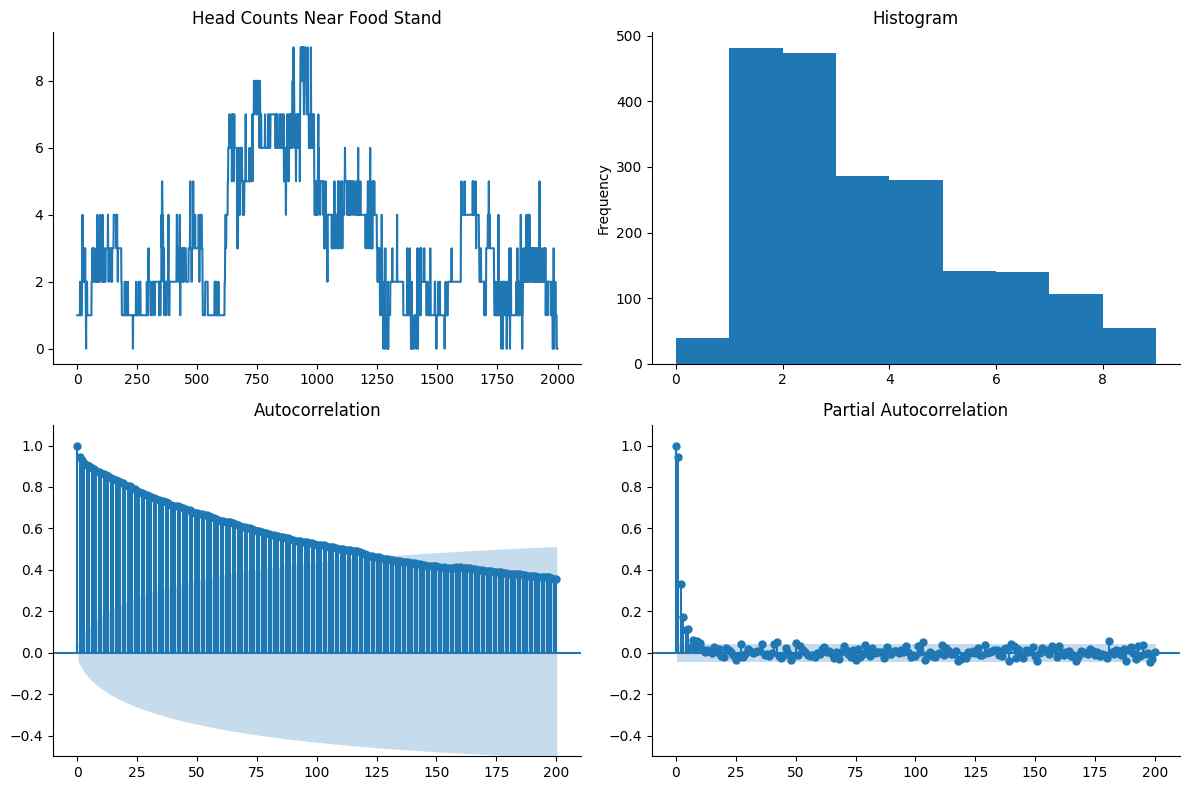
ROI 1 (Food Stand)
The main feature in ROI 1 is the strong correlation past values. If we imagine a mall like a people container, then the food stand and benches are sub-containers that accumulate and contain people.
The largest stable cluster contains up to 6-7 people. From the autocorrelation plot, the life time of people clusters last typically on average 125 frames, that is, ~1 minute. Moreover, from the limited data that we have got, it seems that the larger the cluster, the longer the lifetime.
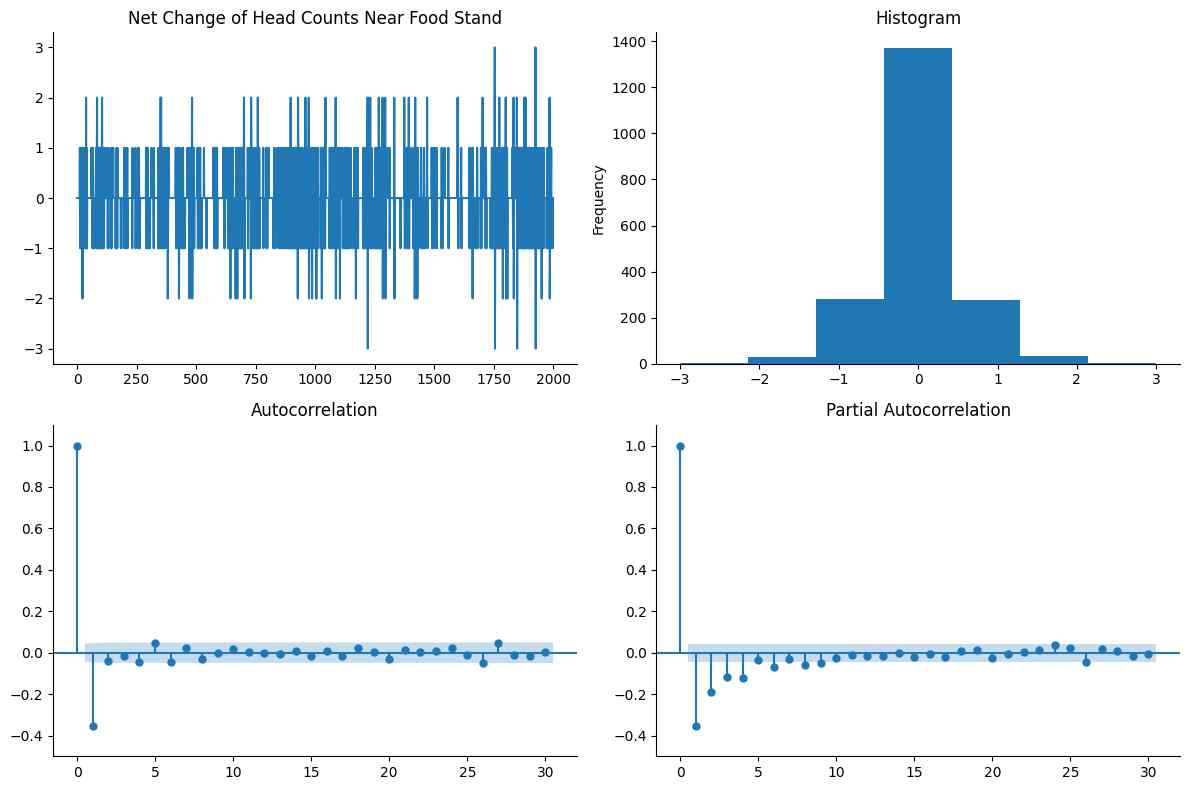
The first differencing shows a similar noise behavior to that of the ROI 0.
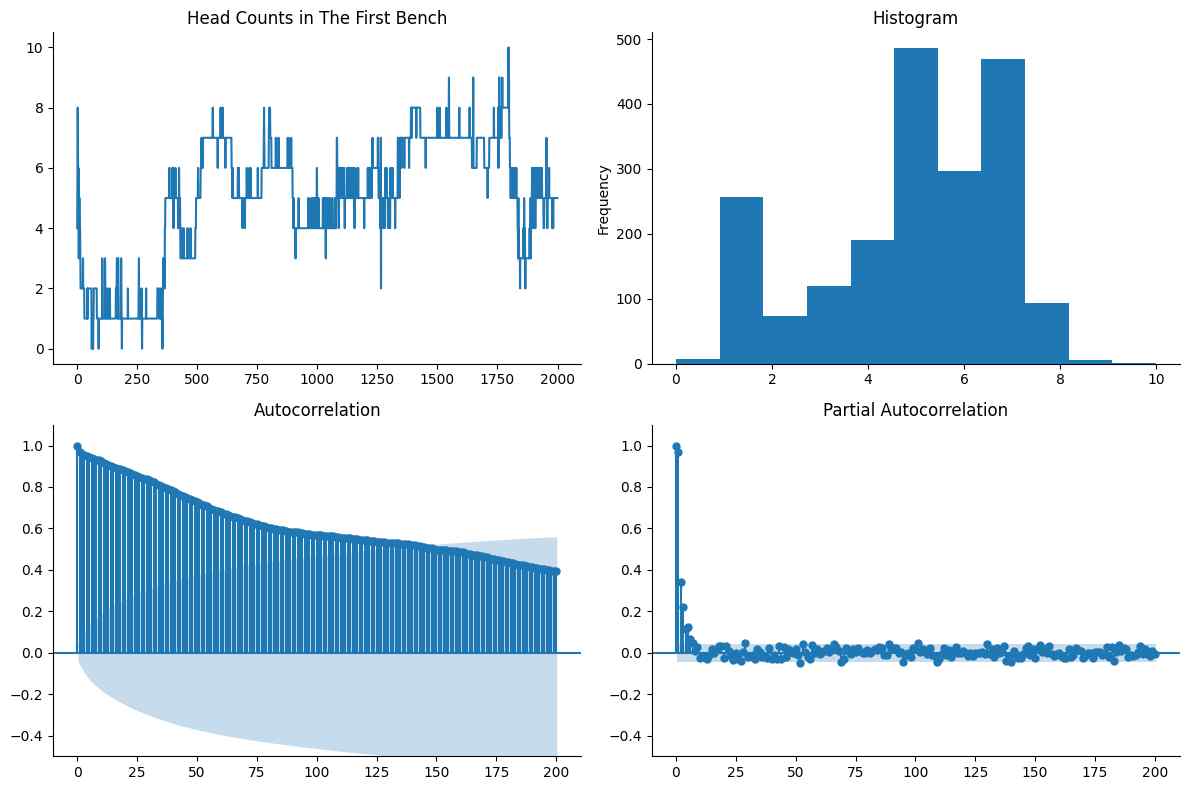
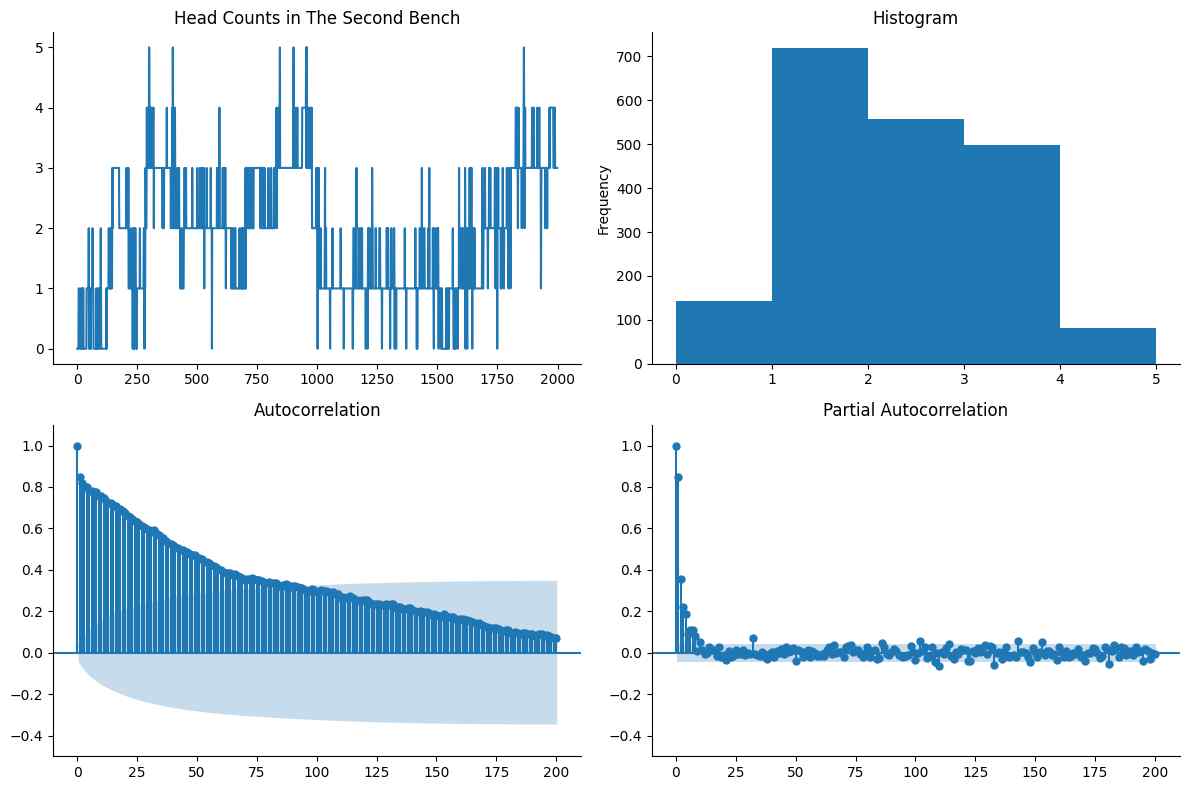
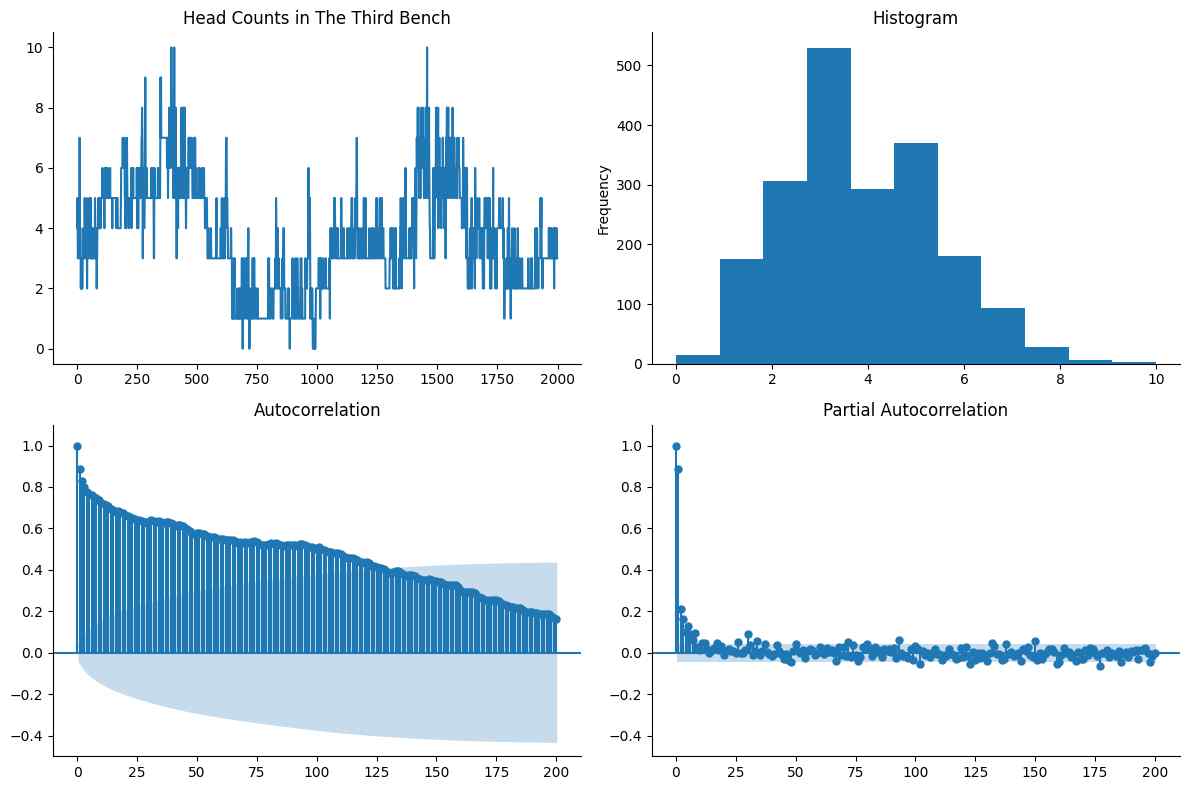
ROI 2-4 (Benches)
For the benches, we can readout the cluster lifetime of around 1 min similar to that of the food stand, with an exception of the second bench. This discrepency may arise from the fact that part of the bench is obscured by a tree, rendering this readout unreliable.
The first differencing yields time series of net change similar to the food stand, therefore, they are omitted in the following plots.
Conclusions
The time series analysis of head count reveals that entry and exit events follow an exponential distribution. The stationary nature of the series without temporal correlations, suggests that these events do not have memory, with people moving in and out randomly and independently.
Further analysis on the spatial distribution of people within the mall shows that, there are self-similar hierarchical sub-structures within the mall, which includes the food stand and the benches within the visible area in this dataset. These areas exhibit distinct statistics compared to the hallway where people exhibit clustering behaviors in terms of space and time, offering a pathway for detailed optimization of mall layout for traffic optimization and effective advertising.