Alcohol Classification based on QCM Sensor Array
Logistic regression, random forest, and gradient boosting are used to perform vapor classification task on QCM electronic nose sensor array. The result challenges the unnecessary complexity in developing neural networks in associated literature.
Analysis Goal
This dataset showcases an experiment utilizing 5 QCM sensors, each coated with different materials, aimed at classifying five types of alcohols. The experiments were conducted on alcohol-air mixtures at five distinct mixing ratios: 0.8:0.2, 0.6:0.4, 0.5:0.5, 0.4:0.6, and 0.2:0.8. Each QCM sensor features two channels, resulting in 10 (2 (channels) x 5 (vapor ratios)) columns, with 25 rows (5 (alcohol types) x 5 (repetitions)) of data for each sensor data file.
In the associated research paper, the authors employed an Artificial Bee Colony (ABC) algorithm, a non-gradient-based optimization method, instead of backpropagation (BP) to train a neural network. This approach is claimed to reduce the likelihood of the network getting trapped in local minima. They also claim that replacing BP with ABC significantly reduced the Mean Squared Error (MSE) for both training and testing, achieving a classification accuracy of 99.73%.
Given the size of this dataset (25 x 10 x 5 = 1250 data points, 5 classes), I can’t help but feel that training a neural network is such an overkill as this task can be solved much more effectively by less complex machine learning models, or even linear models.
In this analysis, sensor signals from various mixing ratios and sensors are considered independent features, despite many being highly correlated. Consequently, we obtain a 25 x 51 dataframe, with one target column for alcohol type and 50 feature columns.
The full analysis with code can be found in this Kaggle notebook.
EDA
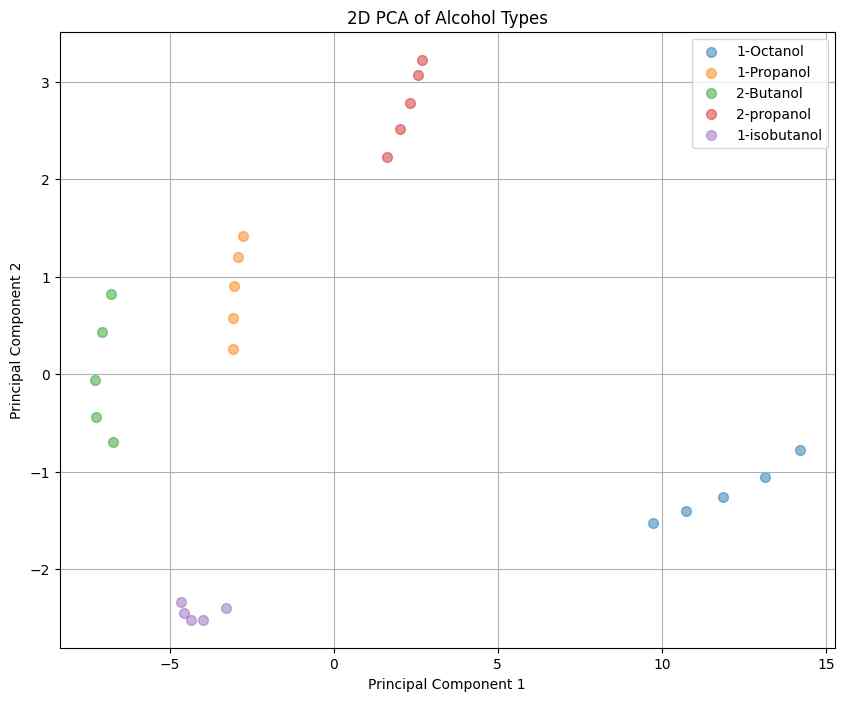
Principal Component Analysis (PCA) was conducted to reduce the feature dimensions from 50 to 2 based on the first two eigenvectors of the standardized data matrix. Visualization on the principal axes shows that each alcohol type can be distinctly separated. This separation confirms that we can proceed with developing classification models without the need for further feature engineering.
Classification Models
First we will do the simplest logistic regression. A train-test split of 0.2 results in a test set with only one instance per class, yet logistic regression correctly classifies all classes. Although the task has become somewhat trivial at this point, for completeness, we will explore more complex models subsequently.
Accuracy: 1.0
Classification Report:
              precision    recall  f1-score   support

   1-Octanol       1.00      1.00      1.00         1
  1-Propanol       1.00      1.00      1.00         1
1-isobutanol       1.00      1.00      1.00         1
   2-Butanol       1.00      1.00      1.00         1
  2-propanol       1.00      1.00      1.00         1

    accuracy                           1.00         5
   macro avg       1.00      1.00      1.00         5
weighted avg       1.00      1.00      1.00         5
Random Forest
As expected, the random forest model also achieves 100% classification accuracy. For a better interpretability, we next consider gradient boosting, as random forests tend to prioritize highly correlated signals.
Accuracy: 1.0
Classification Report:
              precision    recall  f1-score   support

   1-Octanol       1.00      1.00      1.00         1
  1-Propanol       1.00      1.00      1.00         1
1-isobutanol       1.00      1.00      1.00         1
   2-Butanol       1.00      1.00      1.00         1
  2-propanol       1.00      1.00      1.00         1

    accuracy                           1.00         5
   macro avg       1.00      1.00      1.00         5
weighted avg       1.00      1.00      1.00         5
Gradient Boosting
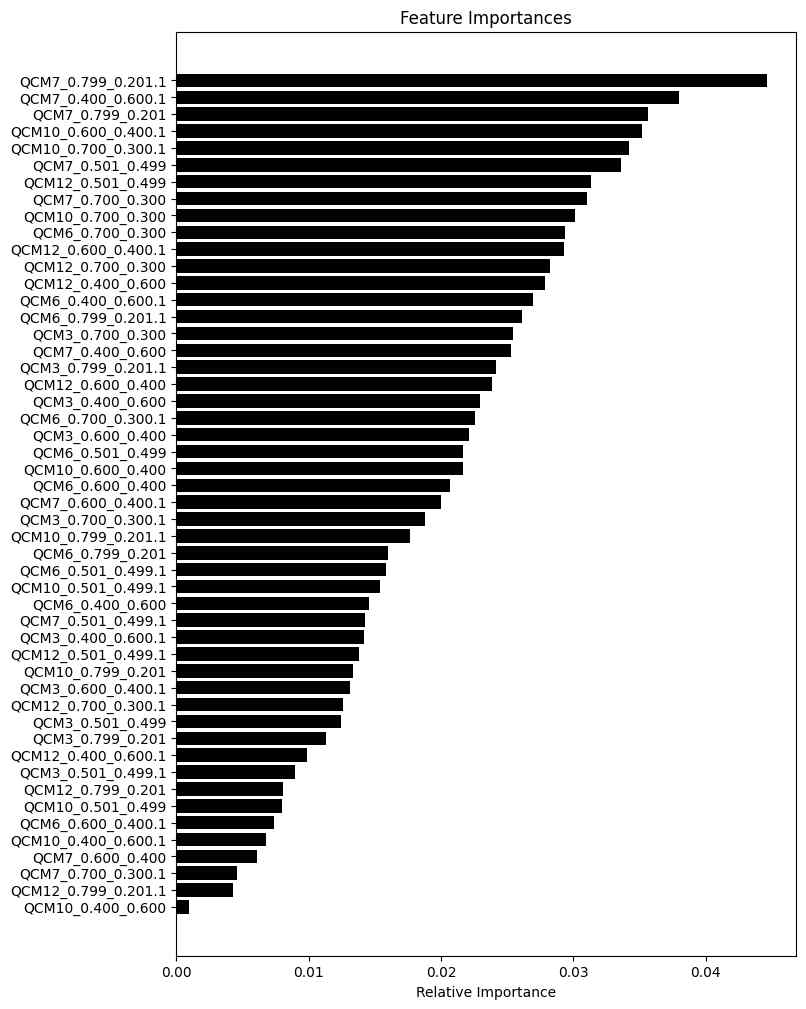
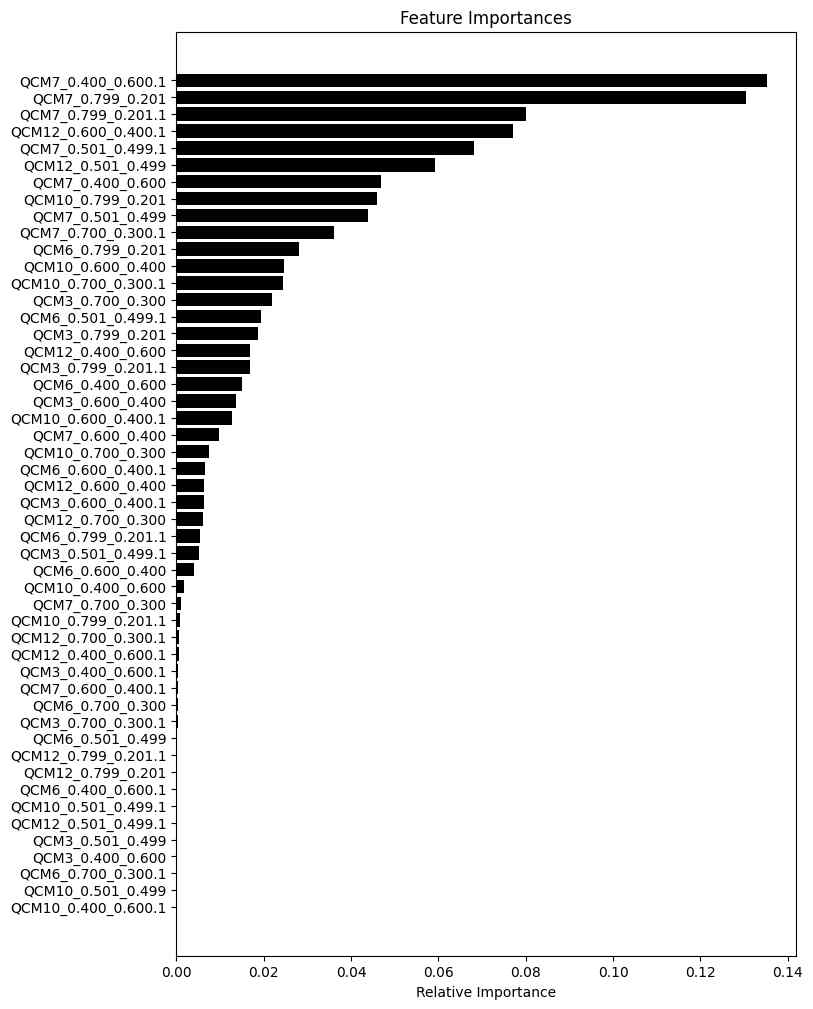
Gradient boosting models exhibit less correlation between trees compared to random forests, leading to a feature importance ranking that highlights several top features rather than a gradual decline in importance. This ranking reveals that the ‘QCM7’ sensor is particularly crucial for this task. Some sensors are deemed of zero importance, suggesting a method to eliminate unnecessary experiments and sensors in scaled-up studies.
Accuracy: 1.0
Classification Report:
              precision    recall  f1-score   support

   1-Octanol       1.00      1.00      1.00         1
  1-Propanol       1.00      1.00      1.00         1
1-isobutanol       1.00      1.00      1.00         1
   2-Butanol       1.00      1.00      1.00         1
  2-propanol       1.00      1.00      1.00         1

    accuracy                           1.00         5
   macro avg       1.00      1.00      1.00         5
weighted avg       1.00      1.00      1.00         5
Conclusions
This analysis successfully classifies five different alcohols using QCM sensors with simple logistic regression achieving 100% accuracy. This approach, known as electronic nose or artificial olfaction, leverages high-dimensional signal signatures from sensor arrays to perform the task of vapor species classification.
Subsequent analysis with gradient boosting maintains this level of accuracy, with feature importance rankings identifying the ‘QCM7’ sensor as particularly significant.
It’s noteworthy that the original paper’s neural network-based methodology failed to reach 100% accuracy for this straightforward task. It is likely due to an overly complex model architecture and potential flaws in model design.