Soccer Player Dynamics: An In-depth Data Analysis of Player Movements and Team Synchronization
Discover how data analysis can reveal key insights into player dynamics and team synchronization in soccer. Learn about player trajectories, characteristic areas, order parameters, and anomaly detection. Kaggle Notebook.
Analysis Goal
In this analysis, we will examine 30 minutes of annotated footage from a soccer game. Drawing inspiration from a study on player dynamics (source), our focus will be on:
- Analyze player trajectories, spatial dispersion, and formation changes over time.
- Investigate the dynamic synchronization of player movements in response to game events.
- Apply anomaly detection to identify significant events, such as timeouts.
The full analysis with code can be found in this Kaggle notebook.
Individual-level Analysis
Player Trajectories
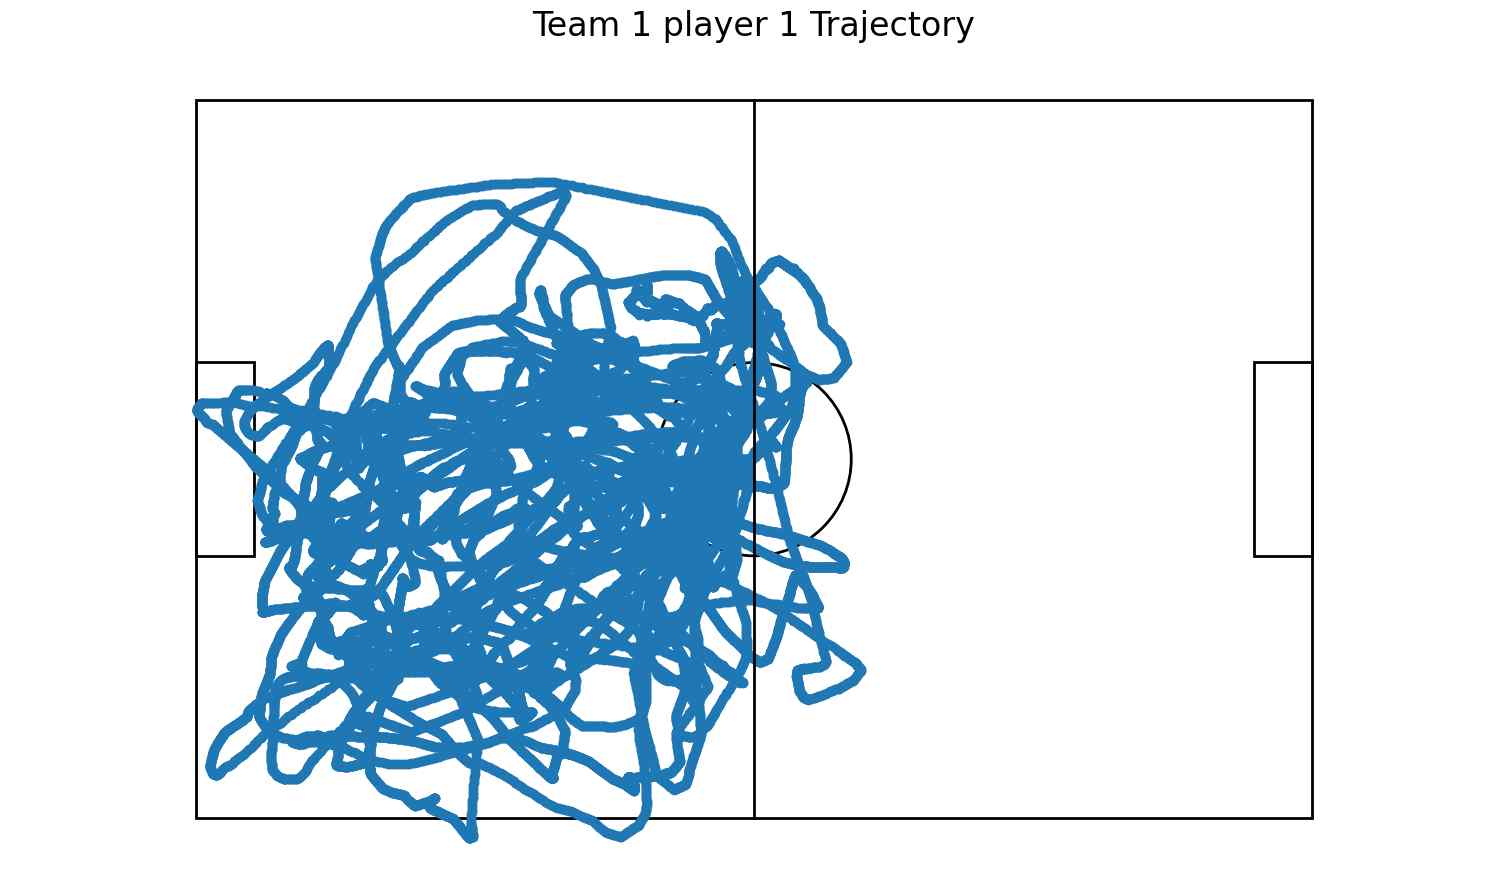
Upon compiling the complete time series data, we can plot the trajectories of individual players throughout the 30-minute match.
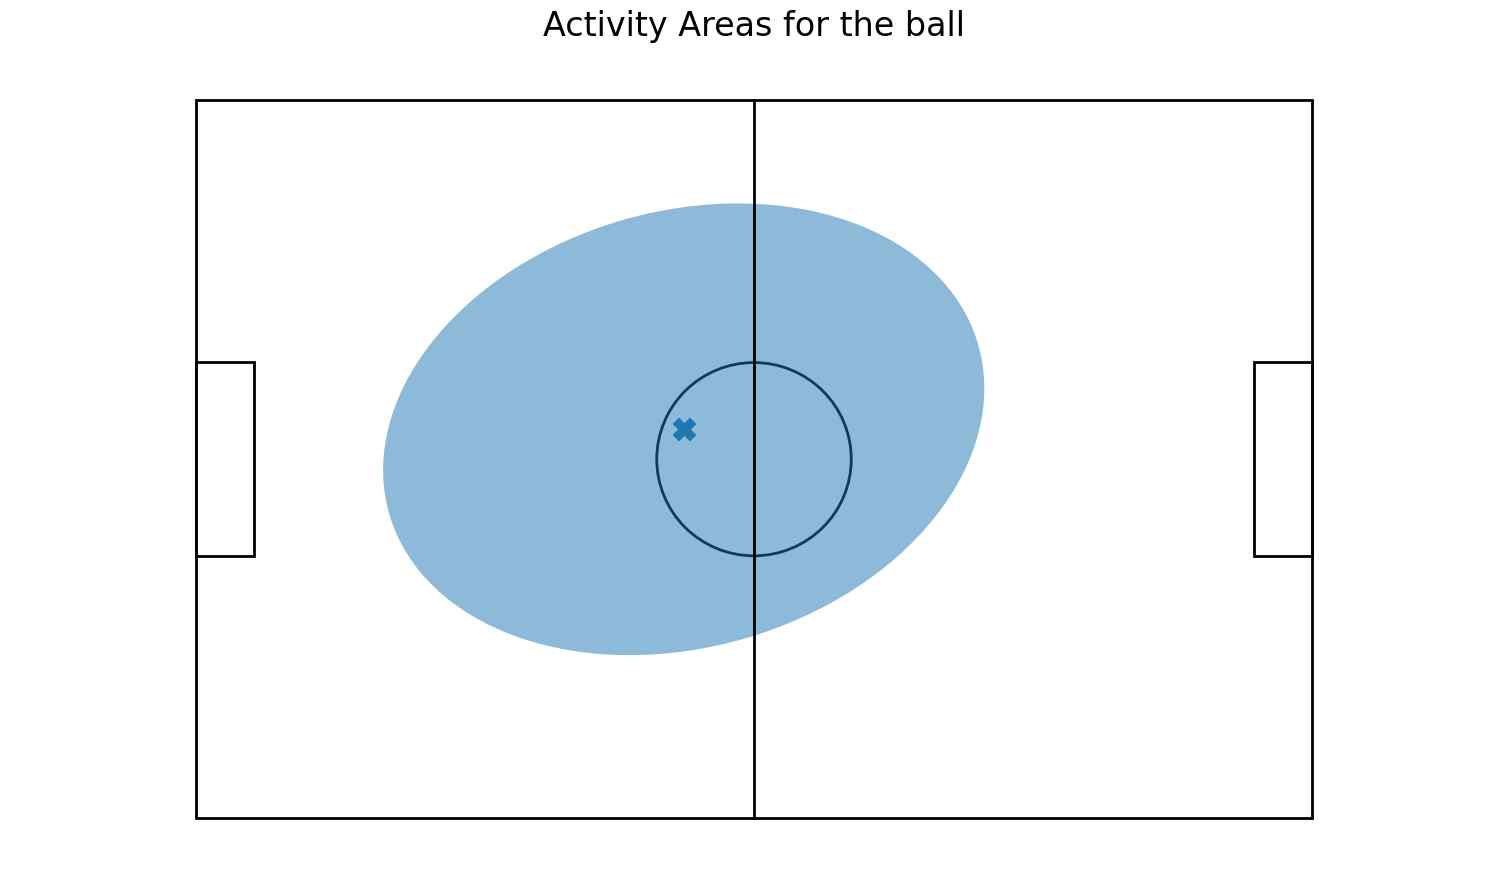
Player Activity Area
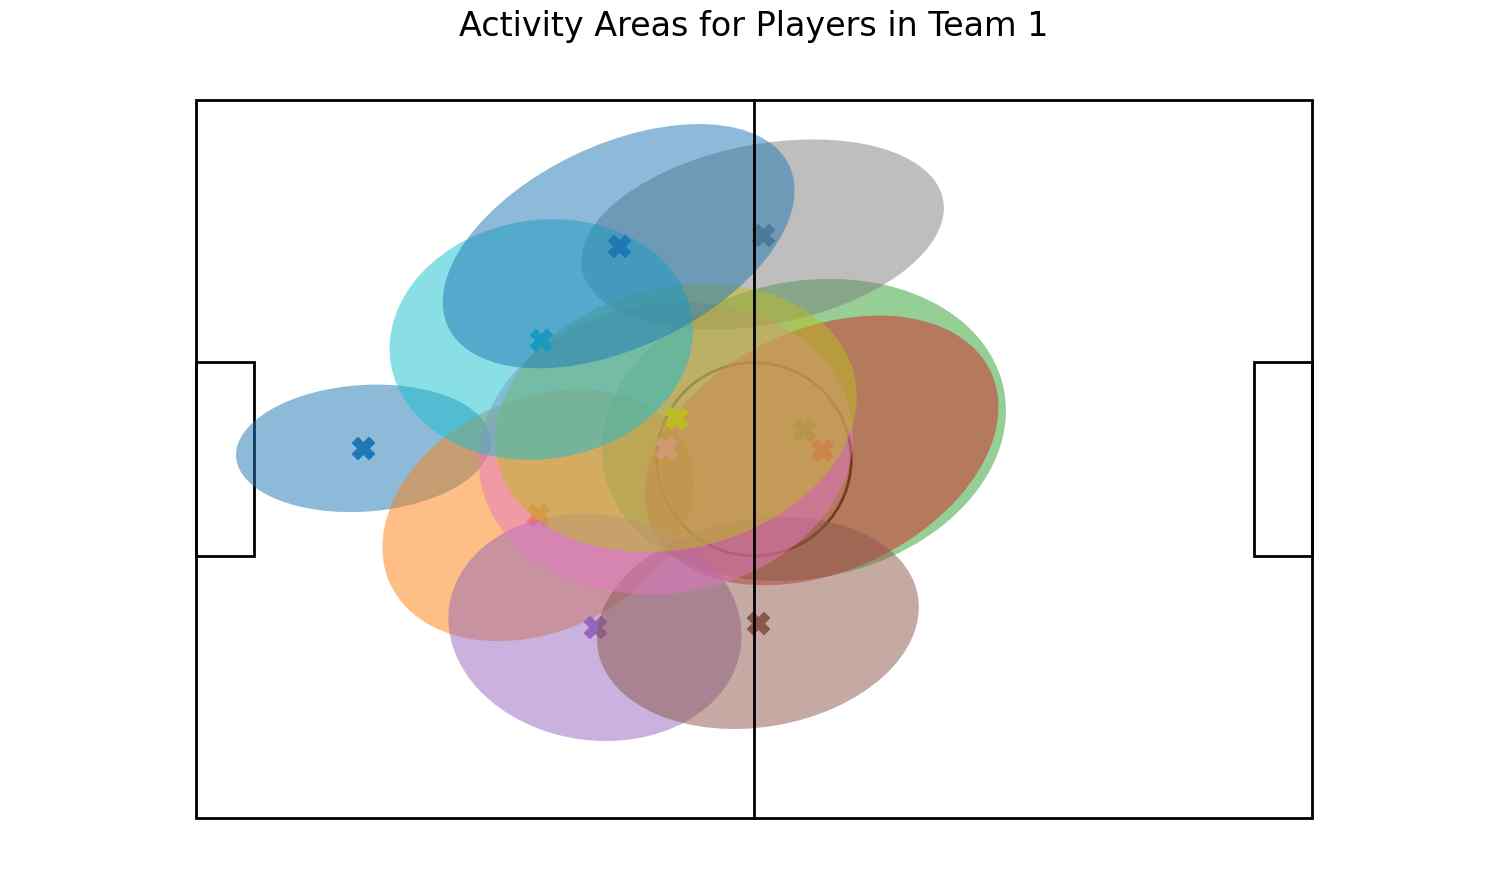
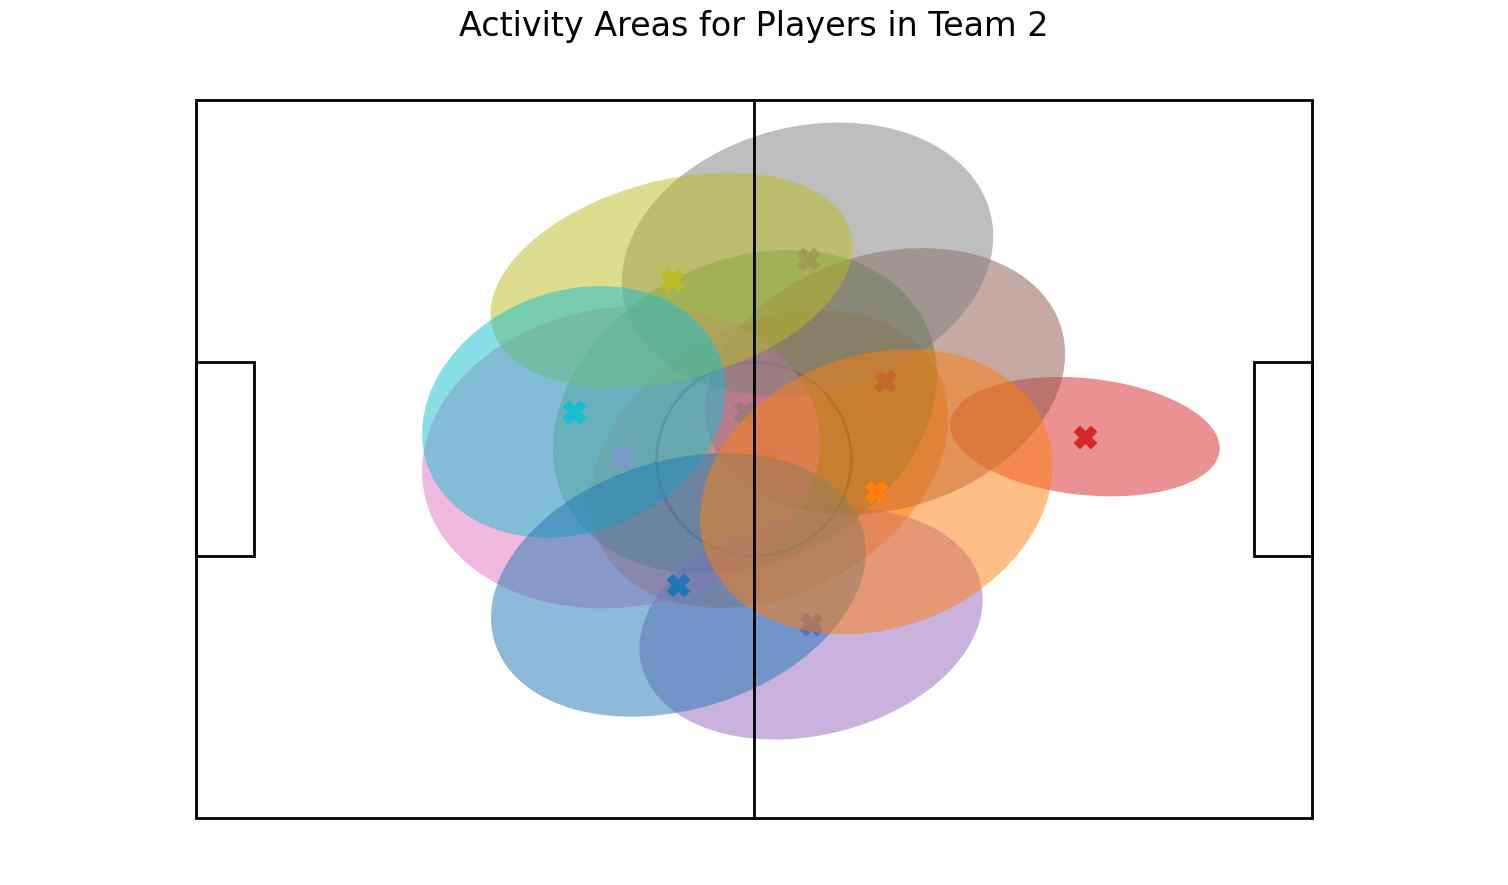
We can visualize a player’s activity area as an ellipsoid, centered at their mean position, with axes derived from the largest eigenvectors of the position data. The visualization reveals:
- Goalkeepers have a significantly smaller activity area compared to outfield players.
- Team 2 displays more aggression, evidenced by several players having their activity areas predominantly in Team 1’s half, a pattern not observed in Team 1.
- In line with Team 2’s aggressive play, the ball is predominantly located in Team 1’s half.
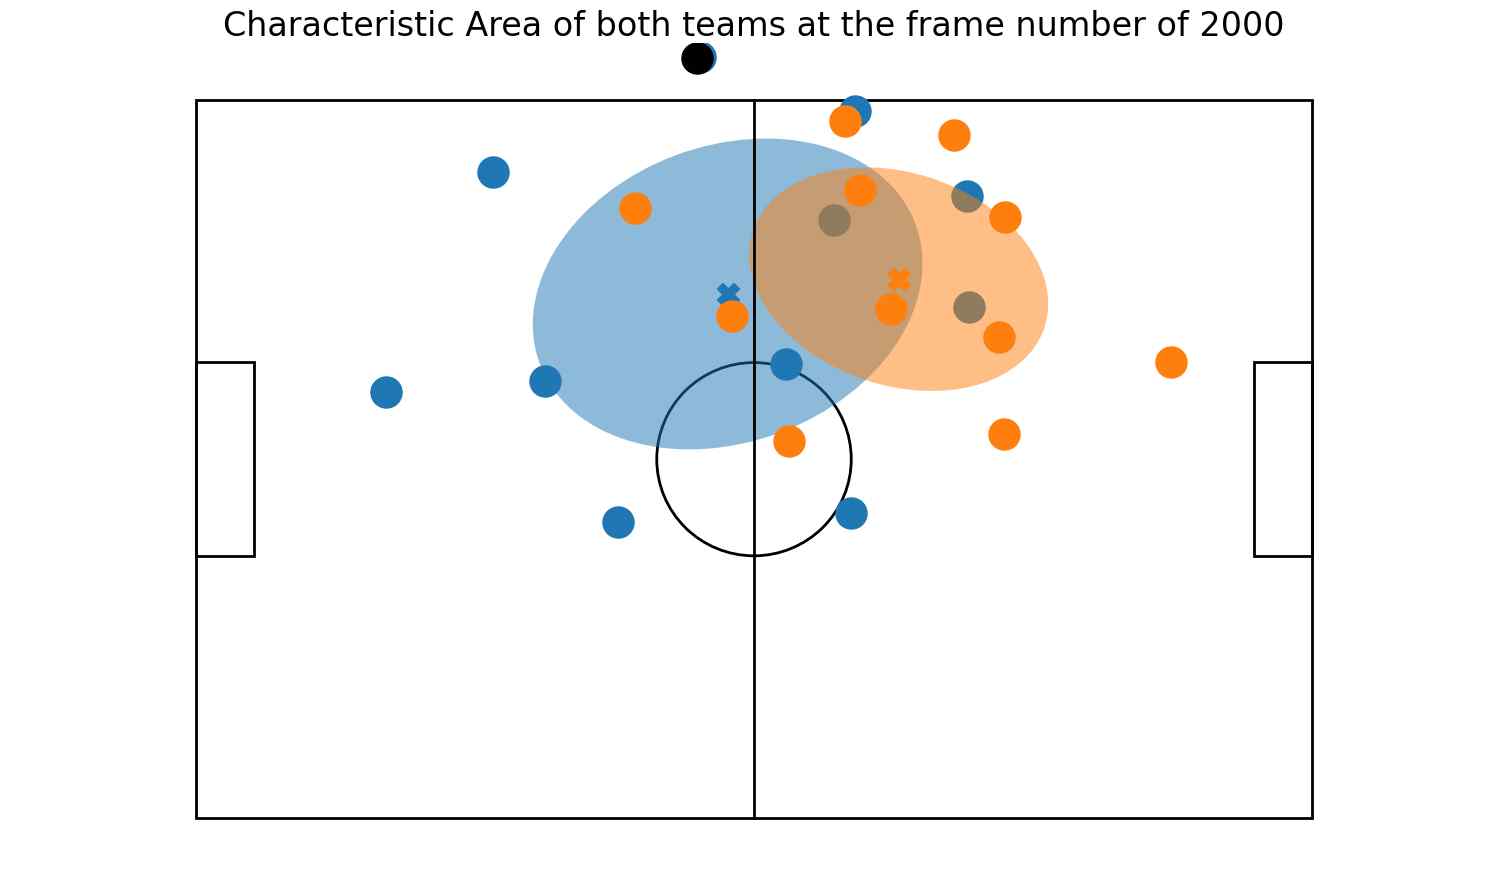
Team-level Dynamics
We now shift focus to team dynamics by plotting the characteristic areas of both teams. These areas, defined by the standard deviation of player positions at given times, reflect the spatial distribution of players at any given point in time. Visualizing the entire match in this way reveals two dynamic blobs—representing each team—that move, rotate, expand, and contract in response to the game’s flow.
Animation
The motions of the dynamic blobs can be compiled into a movie. The full length video is uploaded to YouTube.
Analysis on Characteristic Area
To investigate the dynamics, that is, the expansion and contraction of the characteristic areas, both the centers of mass and the total areas from both teams are calculated as a function of time. These values will be appended as additional columns to the original DataFrame. Moreover, the current frame-based index is too fine-grain for our analysis. Therefore, we will transform the DataFrame’s index into a datetime format for more intuitive and convenient analysis.
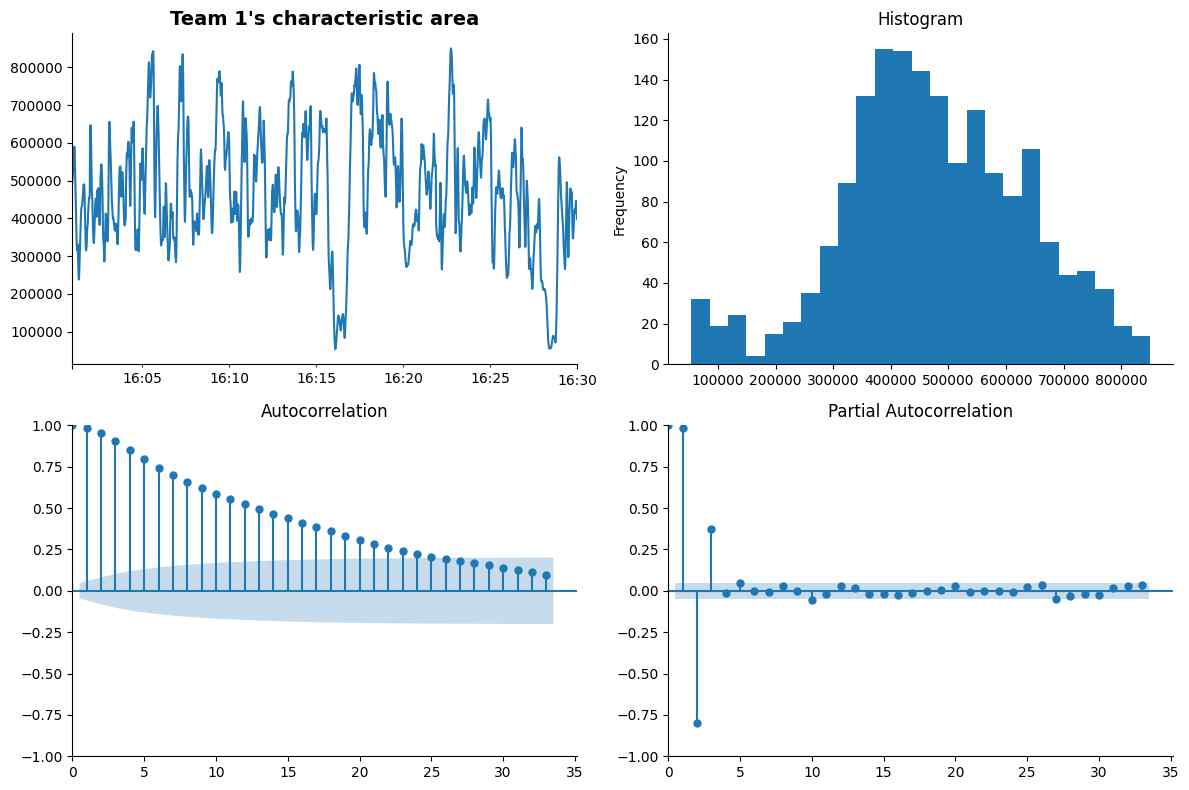
Time Series Analysis
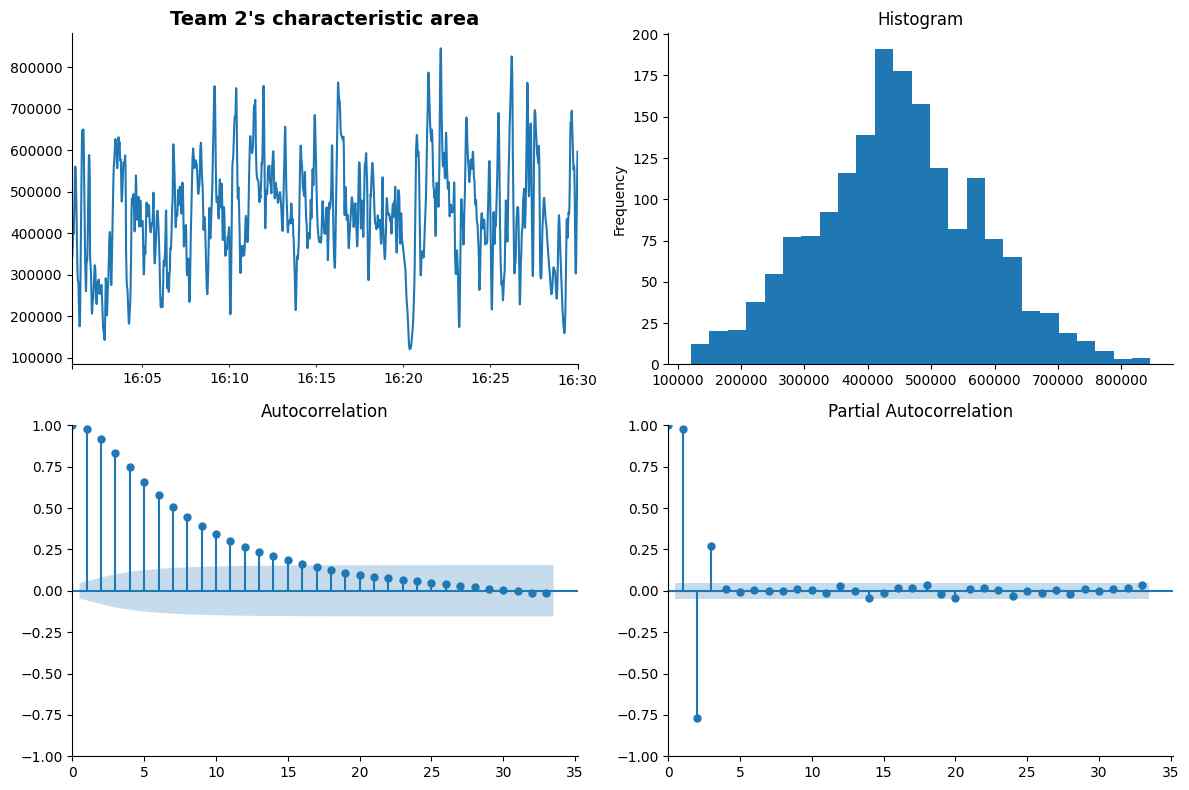
The characteristic area’s evolution shows non-stationarity, evident from significant correlations at small lags in the autocorrelation plot. Visual analysis reveals an average persistence time (a cycle of expansion or contraction) of approximately 23 s for Team 1 and 15 s for Team 2, suggesting a more rapid playing style for Team 2.
Notably, a significant dip in Team 1’s characteristic area around the 15-minute mark corresponds to a timeout before a corner kick, where Team 1 players formed a small circle for strategy discussion. A similar pattern is observed at the 28th minute, marking another short timeout. The timeouts are also apparent in the histogram as the small peak left of the main peak.
Synchronization
The divergence and convergence of players within a team, relative to the team’s frame of reference, reflect the intricate interplay of cooperation and competition. The temporal dynamics observed can serve as indicators of the team’s collective attentiveness and responsiveness to changing situations, such as the ball’s movement.
Another key aspect of team dynamics is synchronization, which refers to the coordinated movement of players during gameplay. To illustrate this, we will calculate player velocities and directions using the existing coordinate data and animate instances of synchronization among the players.
Animation
To visualize synchronization, we use the following criteria: a link is drawn between two players if they move in the same direction for over 2 seconds. This link disappears when their movements diverge for more than 2 seconds, using a 20% tolerance in motion angle to define synchronization.
The animation below shows that synchronization commonly occurs during ball-chasing, often manifesting in waves and involving both teams simultaneously. Conversely, desynchronization typically happens when players from opposing teams converge towards the ball from different directions. The full-length video can be found in YouTube.
Order Parameter
Order parameters, akin to those used to describe liquid crystals or bird flocks, quantify the alignment and synchronization of constituent units. A high value indicates uniform movement direction across the group, while a low value signifies divergent movement directions.
We use the directions for all players in df_direction to compute the order parameter using the formula:
| $$\phi(t)=\frac{1}{N}\sum_{n=1}^{11}\frac{v_n(t)}{ | v_n(t) | }$$. |
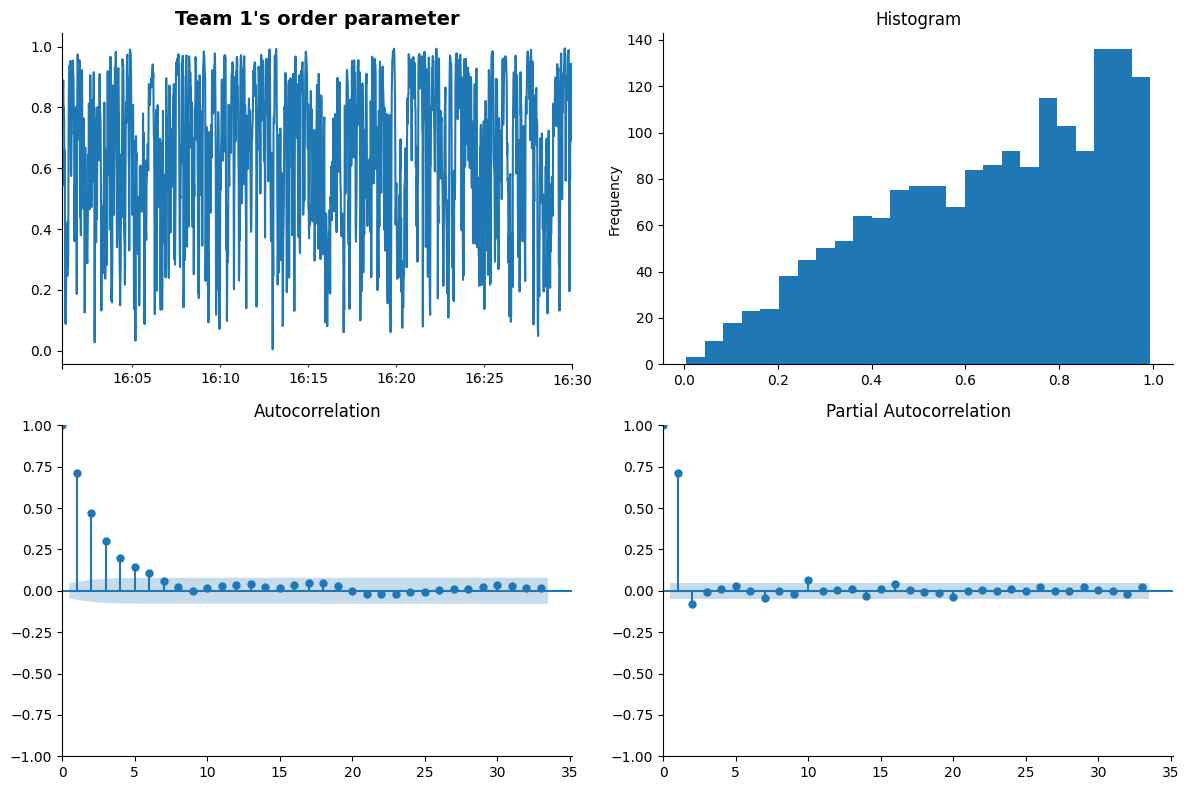
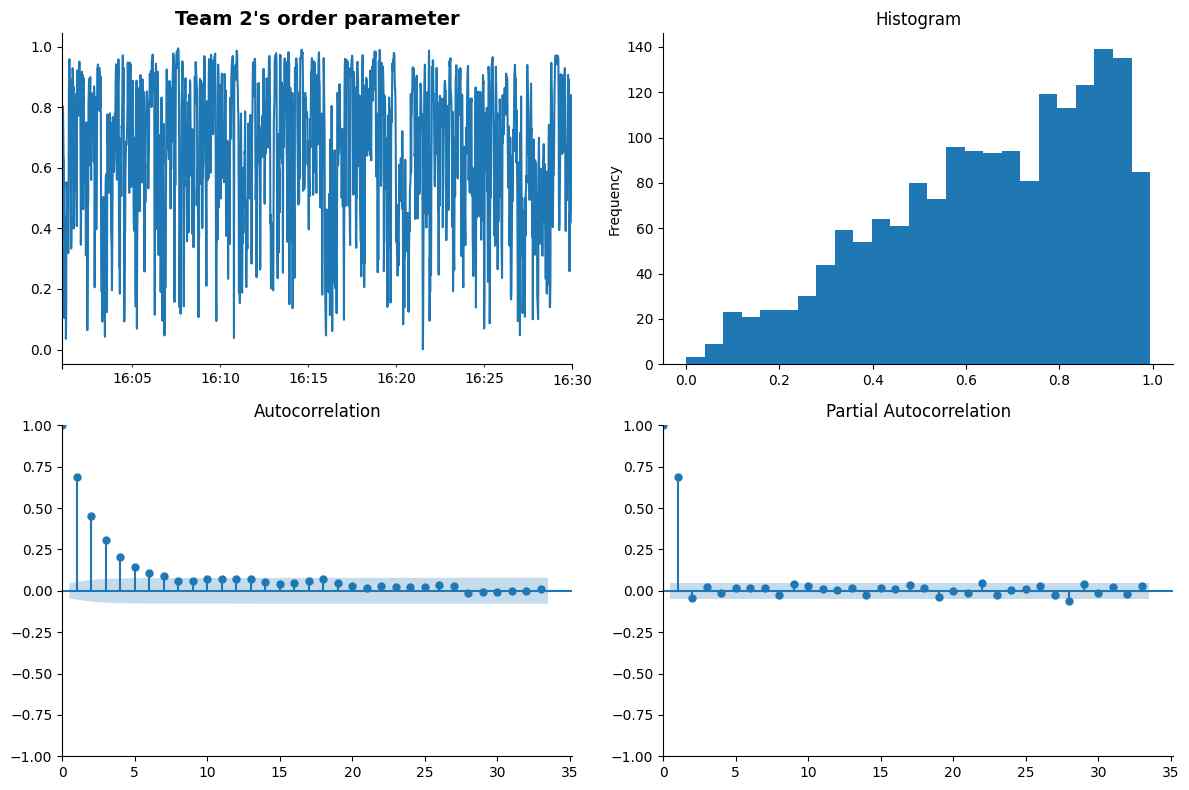
The time series of the order parameter \(\phi\) for both teams is visualized below, which reveals that:
- There are unusual periods of desynchronization, where players move in random directions. These periods coincides with shrinking characteristic area observed previously.
- The autocorrelation plot suggests that Team 1 maintains synchronization slightly longer than Team 2, by about one second, though the difference is not statistically significant, which may indicate that the order parameter is a global feature of the game and does not reflect the strategies or play styles of teams
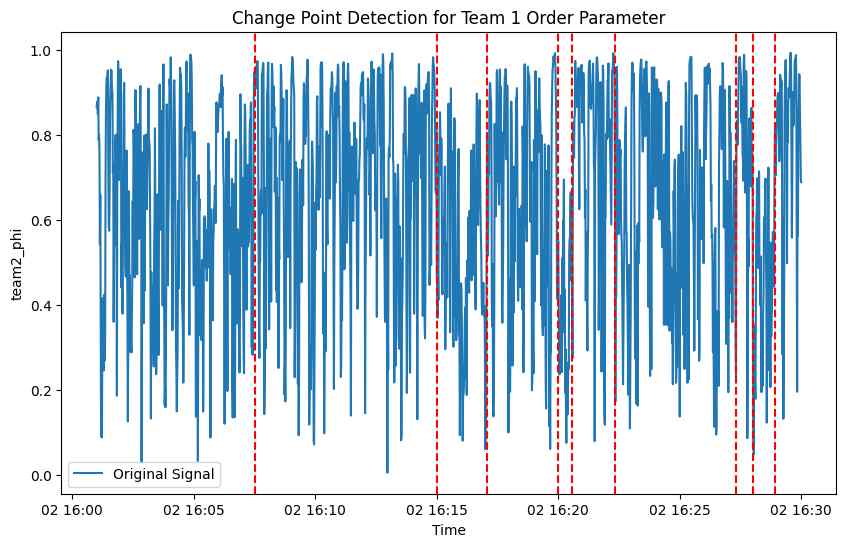
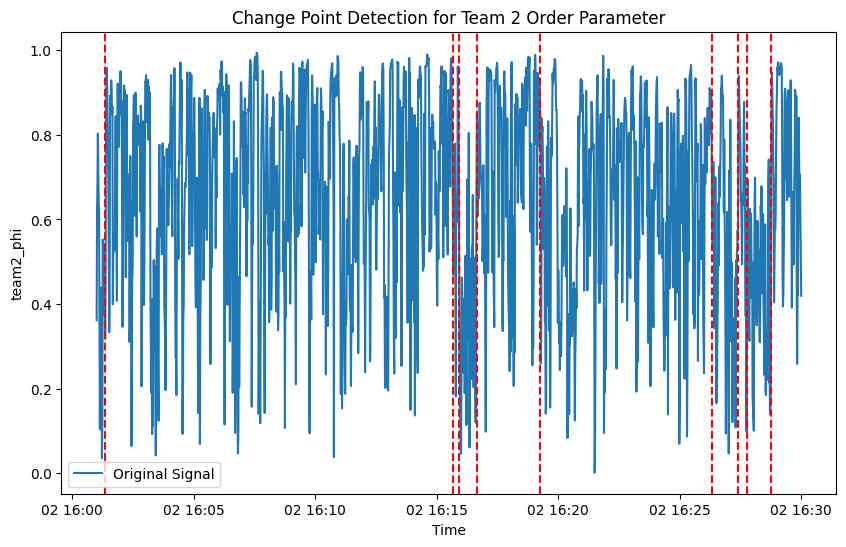
Anomaly Detection
Dips in order parameters, signaling desynchronization, often correspond to short timeouts during injuries, rule infringements, or set pieces like corner or free kicks.
By employing the ruptures package in Python with an l2 model, we can systematically detect these anomalies as shifts in the mean of the order parameter.
After adjusting the number of breakpoints, the model effectively identifies timeout periods for both Team 1 and Team 2. Cross-validation with Team 2’s data corroborates the identified anomalies, confirming timeouts around 16:15 and 16:28. This aligns with the characteristic area reduction observed in previous analyses.
Conclusion
In this analysis, we transformed the annotation file into a time series for detailed study. Our animation and time-series analysis revealed two key dynamics in high-level team play: the characteristic area and synchronization order parameters.
The characteristic area is represented by the team’s mass center and positional standard deviation. This parameter fluctuates and reflects teamplay styles. The order parameter, on the other hand, is a global feature that signifies player synchronization, reflecting the game flow and ball-pursuit dynamics. Extended desynchronization often marks significant game events like timeouts.
These insights lay a foundation for broader analyses across multiple matches, offering a novel approach to team evaluation and comparison. Future research could explore how these dynamics vary when a team faces different opponents, investigating whether changes are driven by opponent competitiveness or are intrinsic to the team.
Thank you for reading and feel free to comment or leave a like in my LinkedIn post!