Magpie Featurization and Superconductor Critical Temperature Prediction Using Tree-based Models
Superconductor dataset with 26k entries is cleaned, featurized using Magpie, and used for underlying physics extraction and critical temperature prediction for data-driven materials discovery.
Article Goal
This dataset comes from the superconductor datasheet curated by the National Institute for Materials Science in Japan. It contains 26k entries of published superconductor records, with columns including chemical formula, critical temperature, and the associated reference.
This article will use a cleaned and featurized dataset taken from here. In the featurization process, we will populate the feature space using the Magpie method in the Matminer package, (repo here) to generate 140+ features solely from the chemical formula. After removing duplicate entries and unvalidated outliers, the total entry count reduces to 16k.
The generated features include:
- Stoichiometry information
- Element properties
- Electron properties
- Ion properties.
For more details on these features, refer to this paper.
In the following, we will explore the dataset to identify the underlying structures inside this dataset and then utilize this information to perform predictive modeling using several machine learning methods, including multiple linear regression (MLR), random forest, and extra tree regressors to establish a baseline for future studies. The code for this article can be found here.
EDA
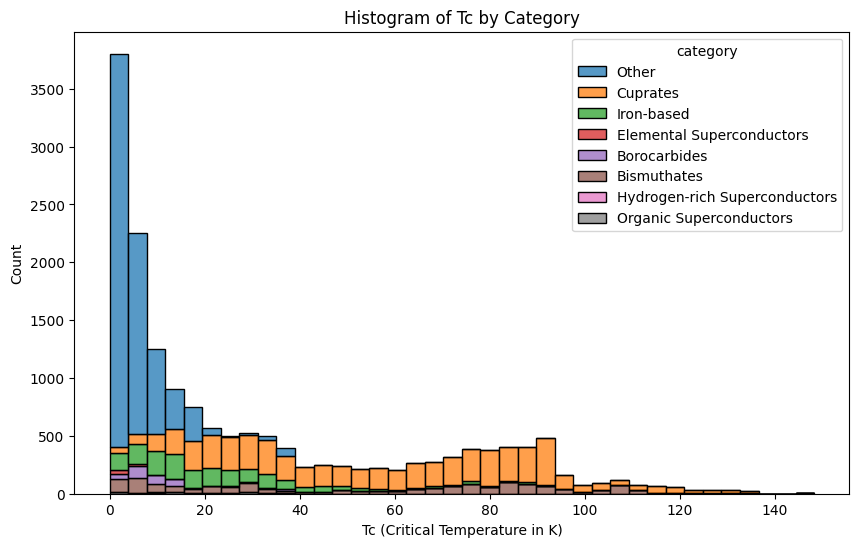
An overview of the number of superconductors by category is shown below in the histogram. For high temperature superconductors, most of them are Cuprates, mixed with iron-based and Bismuthates superconductors.
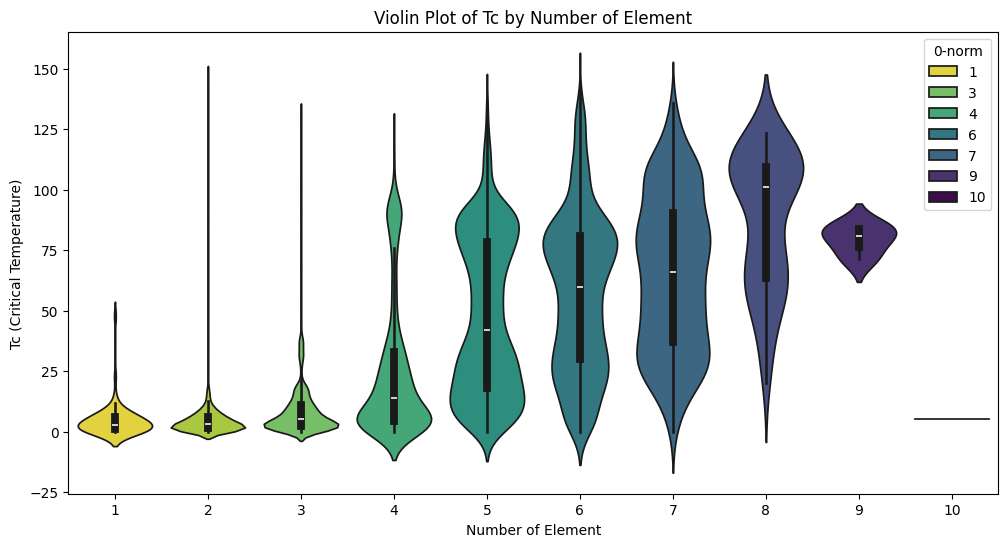
The following violin plot indicates that there is a general tendency for critical temperature to increase with the number of elements, but the increasing trend reaches its peak at element number = 8, and begins to decrease afterwards.
PCA
To reduce the dimension of this dataset with 140+ feature dimensions, we will use a classical dimension reduction technique of principal component analysis (PCA), which identifies the principal axes in the data matrix via eigenvector decomposition.
This operation leads to principal composite dimensions that can explain the maximal amount of variance in the dataset, allowing one to project multi-dimensional data onto 2D/3D plane for visualization.
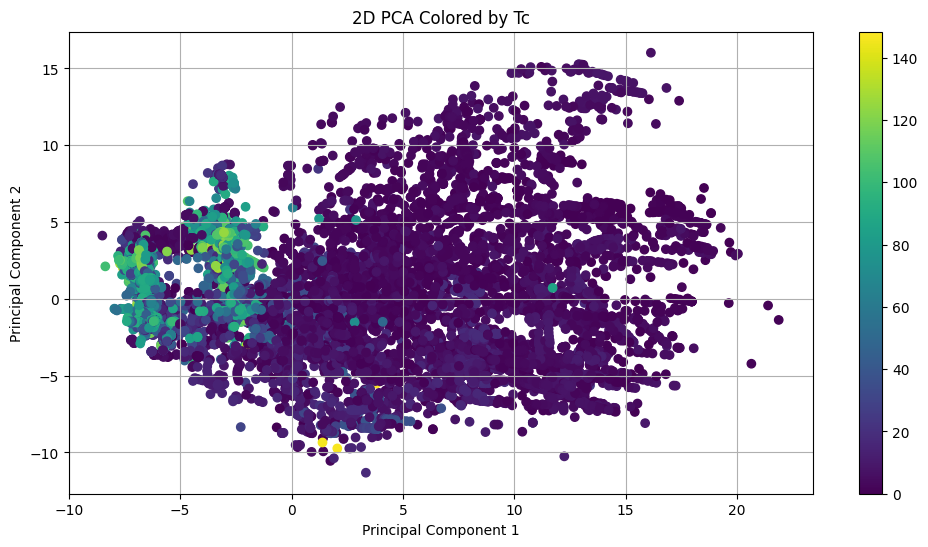
The visualization indicates that superconductors with high Tc tend to cluster at a corner of the projection.
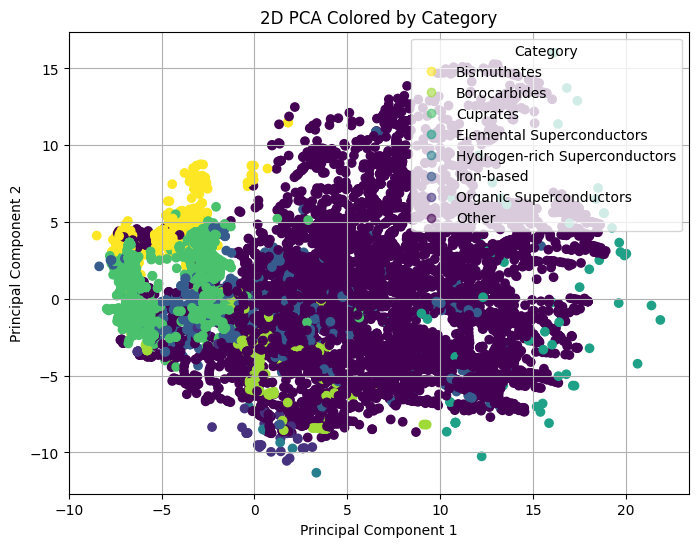
Another color-coding scheme on category indicates that there is a strong overlap between high-temperature superconductor with the cluster of Cuprates. The clustering of superconductor species implies that the chemical formula alone already contains enough information to infer its position in the high-dimensional feature space, and therefore, its superconductivity.
Regression Models
As we have confirmed that the multi-dimensional features indeed contain valuable information about the superconductivity of all these chemicals, next, we will develop regression models aiming to find a model that can best utilize these features to give an accurate prediction on Tc.
Multiple Linear Regression
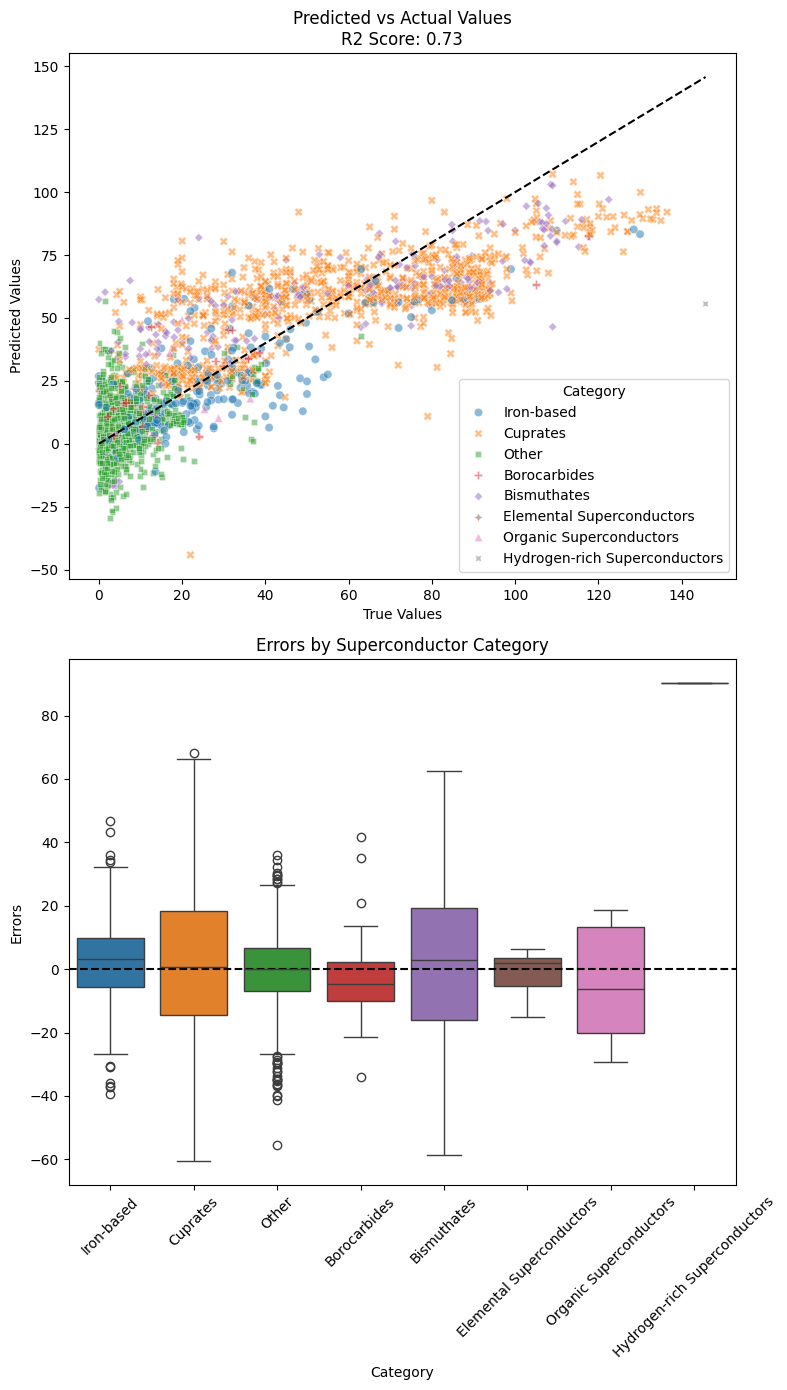
We will start with a linear regression to establish a baseline. Linear regression gives an ok r2 score of 0.73, but it can barely fit features from Cuprates well as indicated by the apparent mismatch between predicted vs actual values graph.
Visualizing their error using barplots show that most of the error comes from Cuprates and Bismuthates, indicating that linear regression not being able to capture the complex and diverse nonlinear correlation between Tc and features.
Nonlinear Models
Since there is a large amount of nonlinear models we can use to do the regression, for convenience, we will use the lazypredict package to get an overview of models that perform the best on this regression task.
                                                                  R-Squared
Model
ExtraTreesRegressor                                                    0.94
RandomForestRegressor                                                  0.93
BaggingRegressor                                                       0.92
XGBRegressor                                                           0.92
LGBMRegressor                                                          0.91
HistGradientBoostingRegressor                                          0.90
KNeighborsRegressor                                                    0.89
DecisionTreeRegressor                                                  0.87
ExtraTreeRegressor                                                     0.86
GradientBoostingRegressor                                              0.85
MLPRegressor                                                           0.84
PoissonRegressor                                                       0.77
SVR                                                                    0.77
For the list of baseline models, we can see that the Extra Tree Regressor gives the best r2 score, followed by random forest and bagging regressor.
Extra Tree Regressor
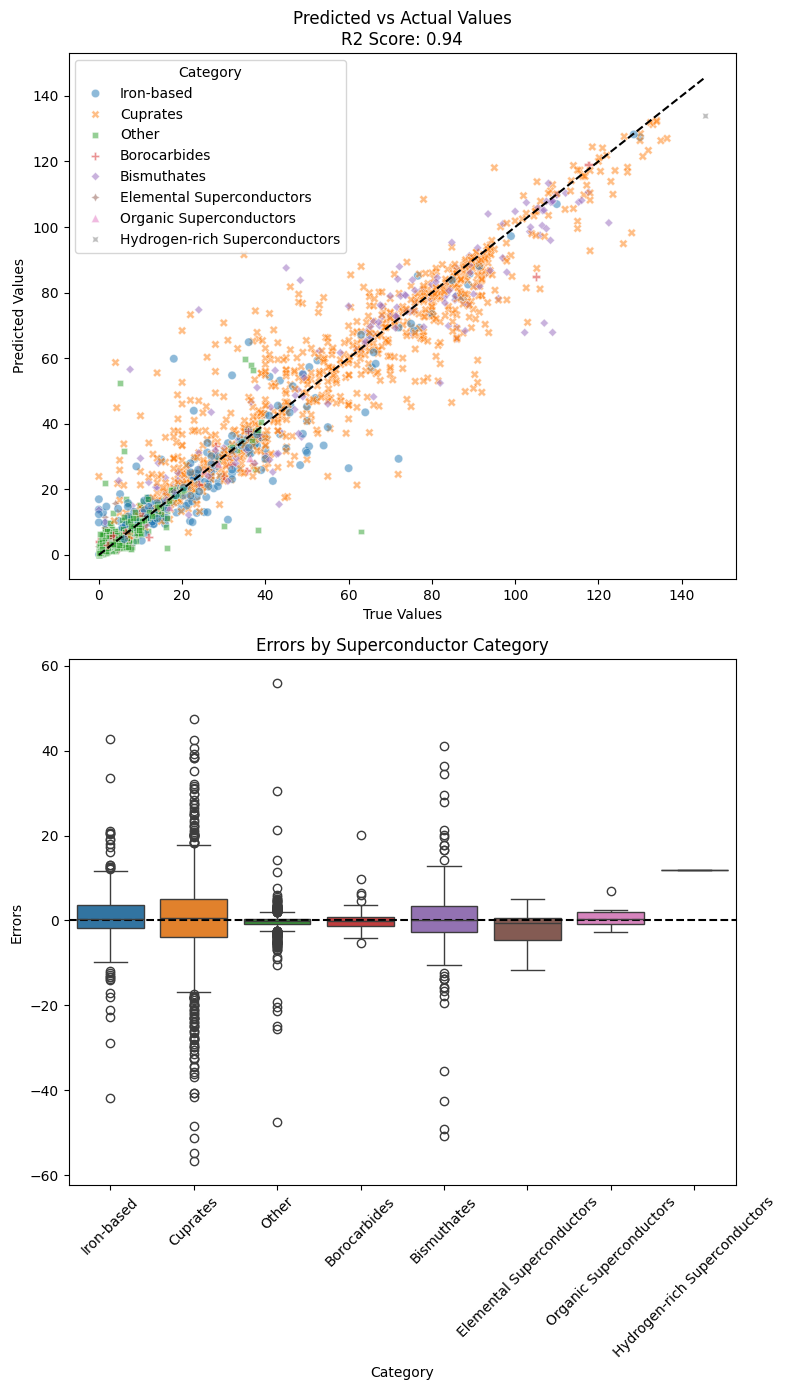
The best performing extra tree regressor gives an r2 score of 0.94, which is 0.2 higher than multiple linear regression. The high score indicates that the nonlinear structure can be effectively learned by the right model.
The error-by-category graph shows that there are barely any bias in the prediction, except for hydrogen-rich superconductor but with a significantly reduced error. Most of the variation comes, still, from Cuprates.
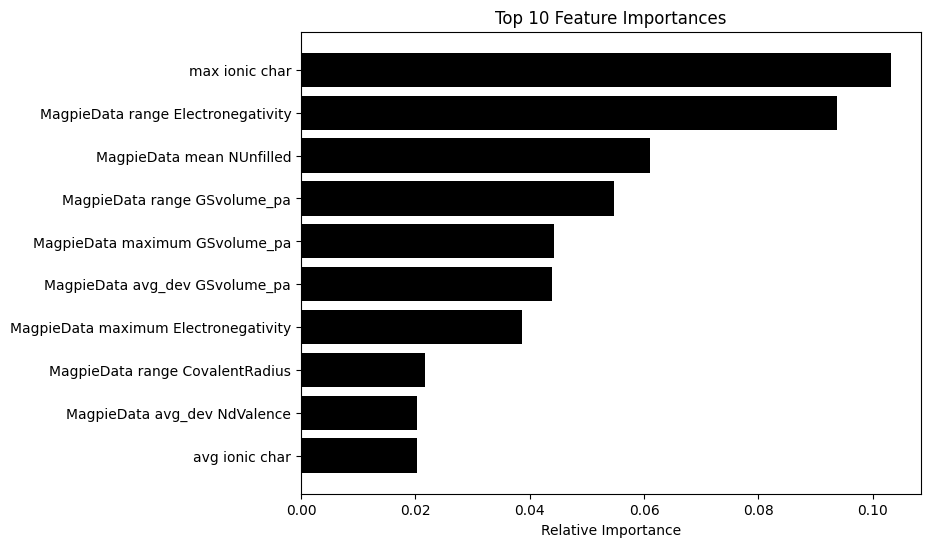
The feature importance ranking shows that the most important features are maximum ionic character, span of electronegativity, and mean unfilled orbit number.
Random Forest
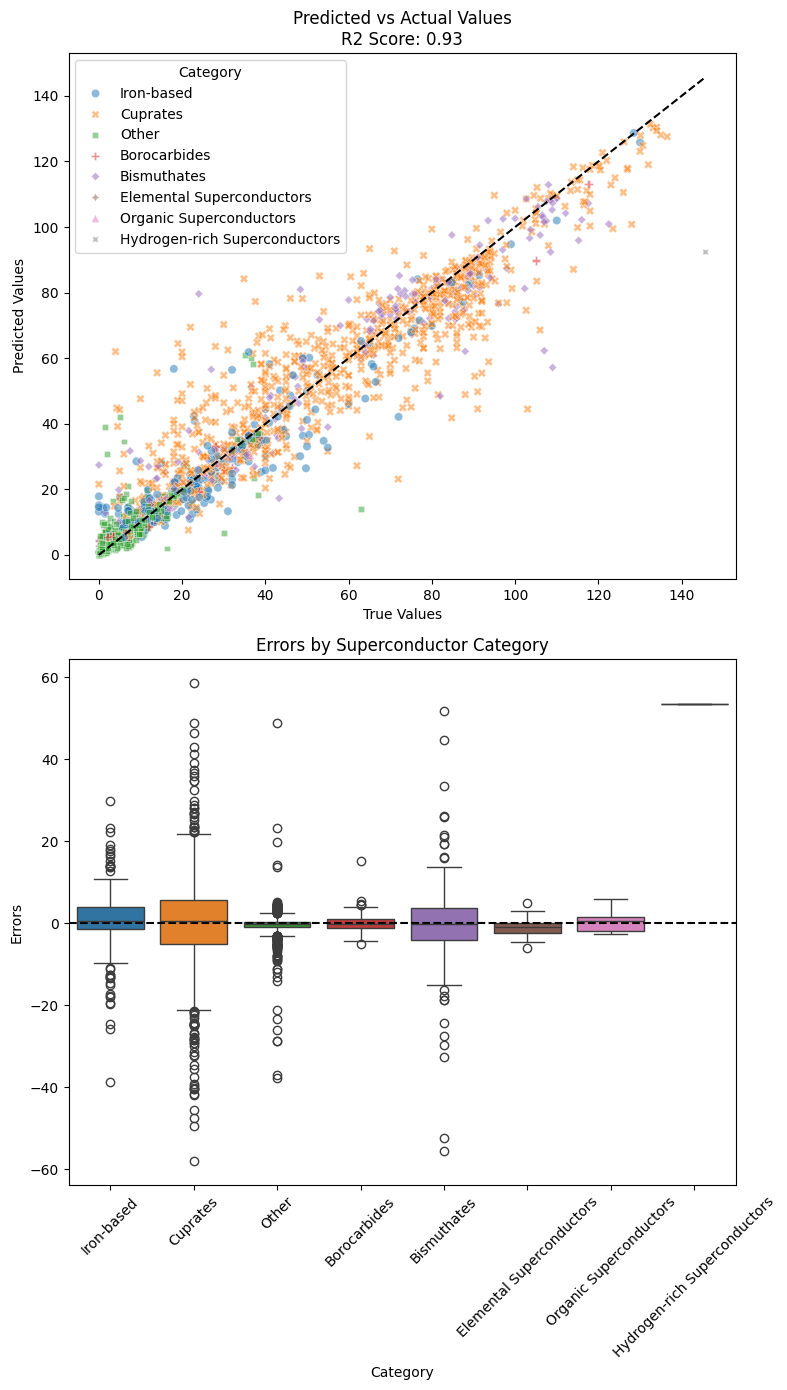
Random forest gives a slightly inferior performance with an r2 score of 0.93. Compared to extra tree regressor, the error in hydrogen-rich superconductor is much higher.
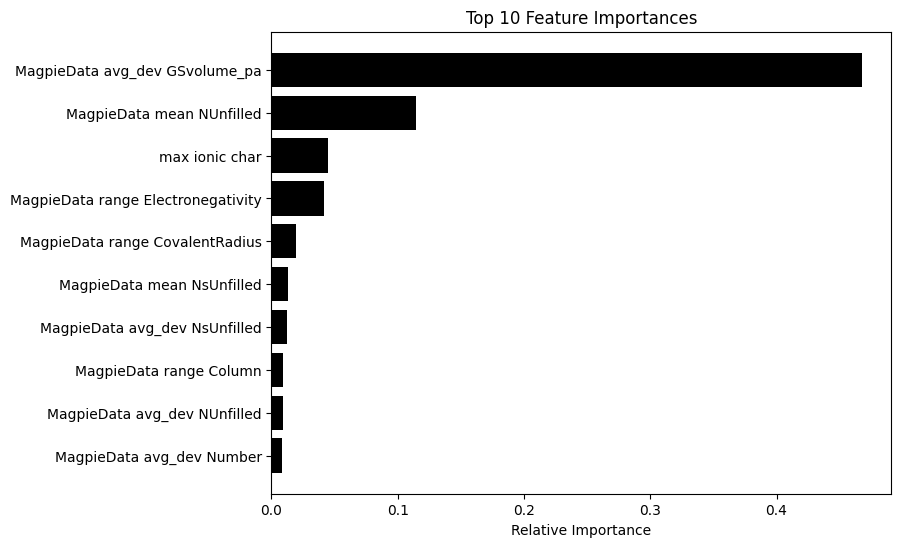
The most important features are average ground state volume, and the same as before, mean unfilled orbit number and the span of electronegativity.
Summary
In this article, we explore the general structure of the dataset and used several machine learning techniques to find that at which level of precision we can predict Tc based on a series of elemental features.
The results are surprising in that, without any structural information, we can accurately predict Tc (r2 up to 0.94) using information from the chemical formula only.
This data-driven approach has been intensively investigated by the materials science community and shown great promise in identifying new superconductors.
As implied by the figure of errors by category shown earlier, the mean source of error comes from using the same model to fit data from multiple different species of superconductors, the error is understandable because they have different superconducting mechanisms. Therefore, further improvement can be achieved by accurate categorization of superconductors and train multiple models and ensembling them to capture different working mechanisms in these superconducting materials.
Thanks for reading!