Microfluidic Fluid-Structure Interaction Modeling
Introduction
Soft lithography techniques, utilizing Poly(dimethylsiloxane) (PDMS), have emerged as a significant alternative to conventional lithography for diverse microfluidic applications. Unlike rigid materials like silicon, PDMS exhibits high compliance and rubber elastic properties, making it susceptible to structural deformation under pressure. These unique properties have been leveraged to design pressure-actuated valves and versatile fluidic control platforms. However, the deformation characteristics of PDMS also impose limitations, particularly in structures with low aspect ratios, affecting the width of channels that can be created and impacting the hydraulic resistance and flow profile in microfluidic channels. Understanding and quantifying such deformations are crucial for applications requiring precise knowledge of flow profiles, pressure, and channel geometry.
This tutorial delineates the COMSOL setup for constructing a fluid-structure interaction model, aiming to simulate the deformation of a microfluidic channel under a flow with a constant flow rate. The theoretical formulation of this problem can be found in this paper.
Setting Up the Model
Geometry Definition
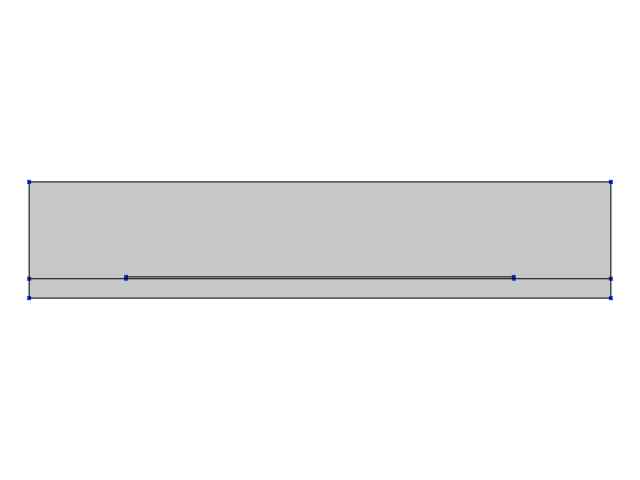
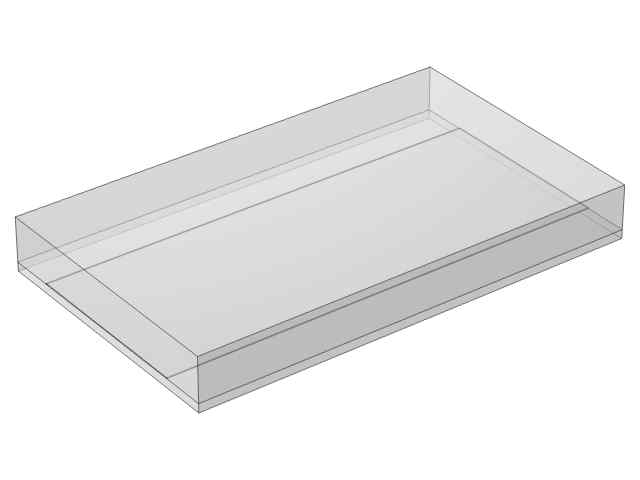
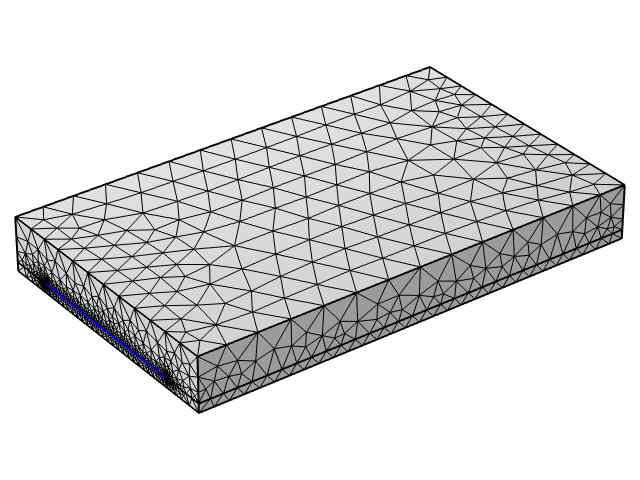
The channel’s cross-section is defined in a 2D work plane, consisting of a substrate, a soft channel on top, and a small rectangular channel in between. The 3D structure is achieved by extruding the work plane to the full channel length. The materials defined are silica glass for the substrate, PDMS for the soft channel, and nitrogen for the channel.
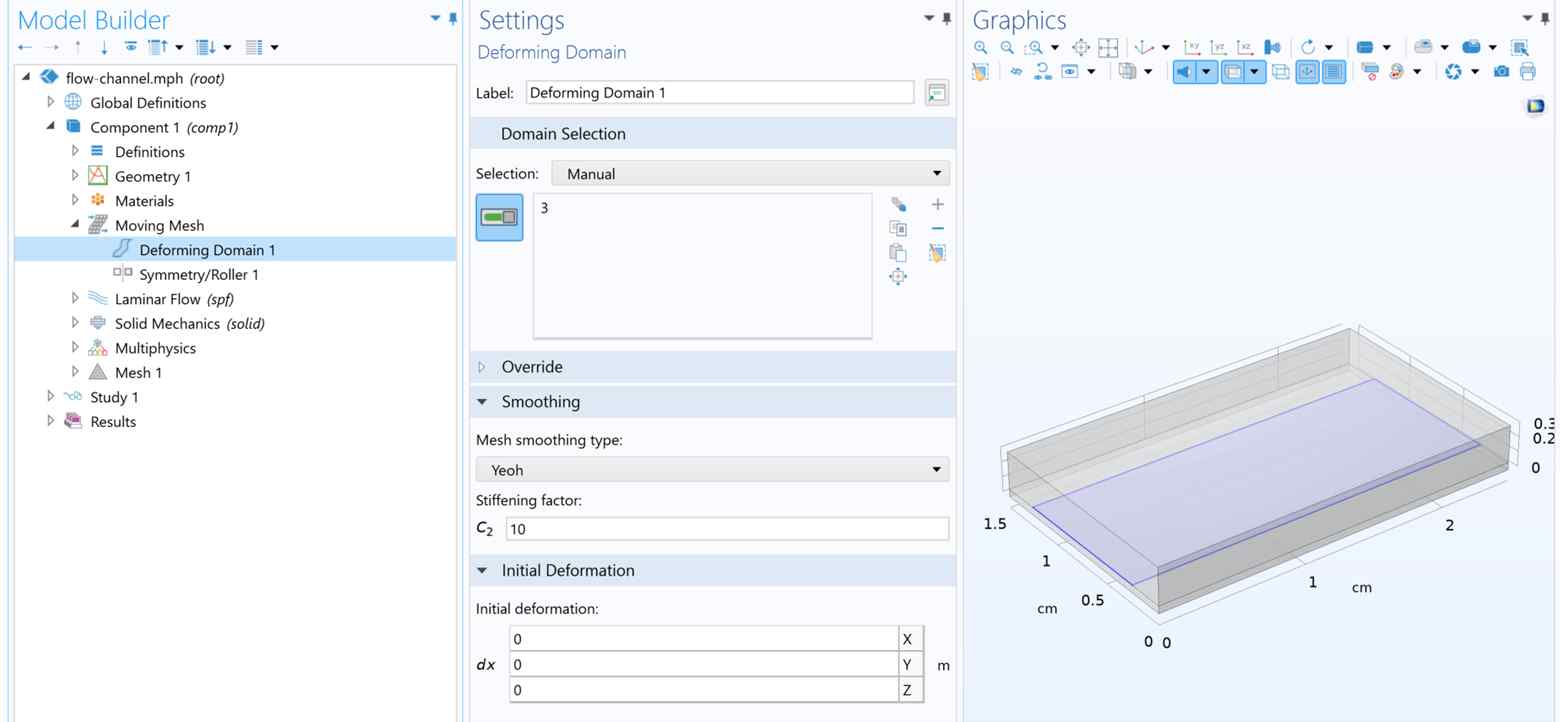
Moving Mesh
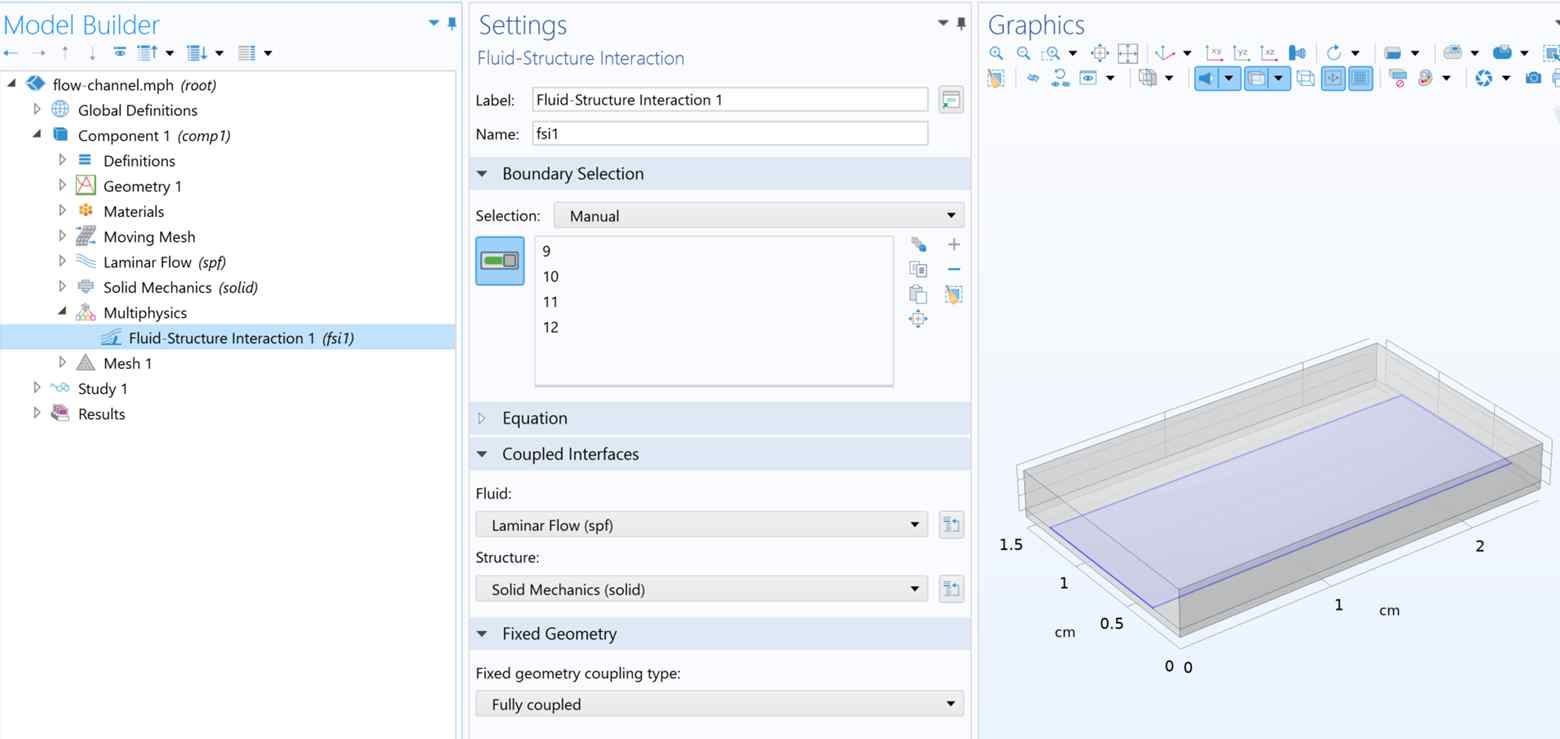
Given that the incoming flow pressure will deform the soft channel and this deformation will reciprocally impact the flow behavior, a moving mesh node is essential to model the channel’s deformation. A symmetry boundary condition is applied on the inlet and outlet to prevent mesh deformation from extruding out of the simulation domain. The coupling between fluid and solid deformation is facilitated through the Fluid-Structure Interaction node in Multiphysics.
Physics
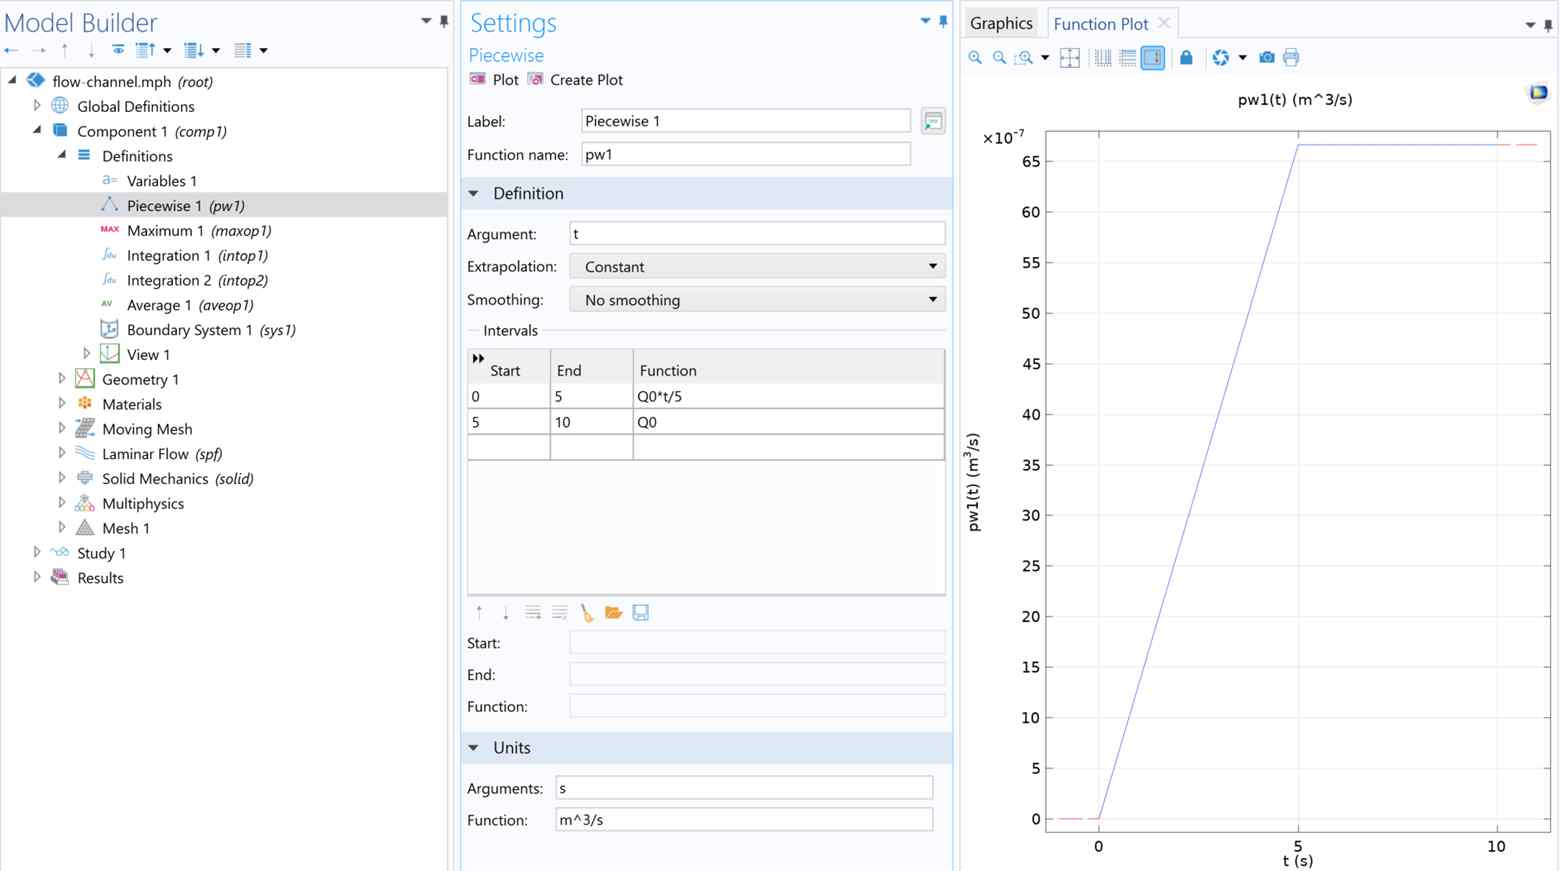
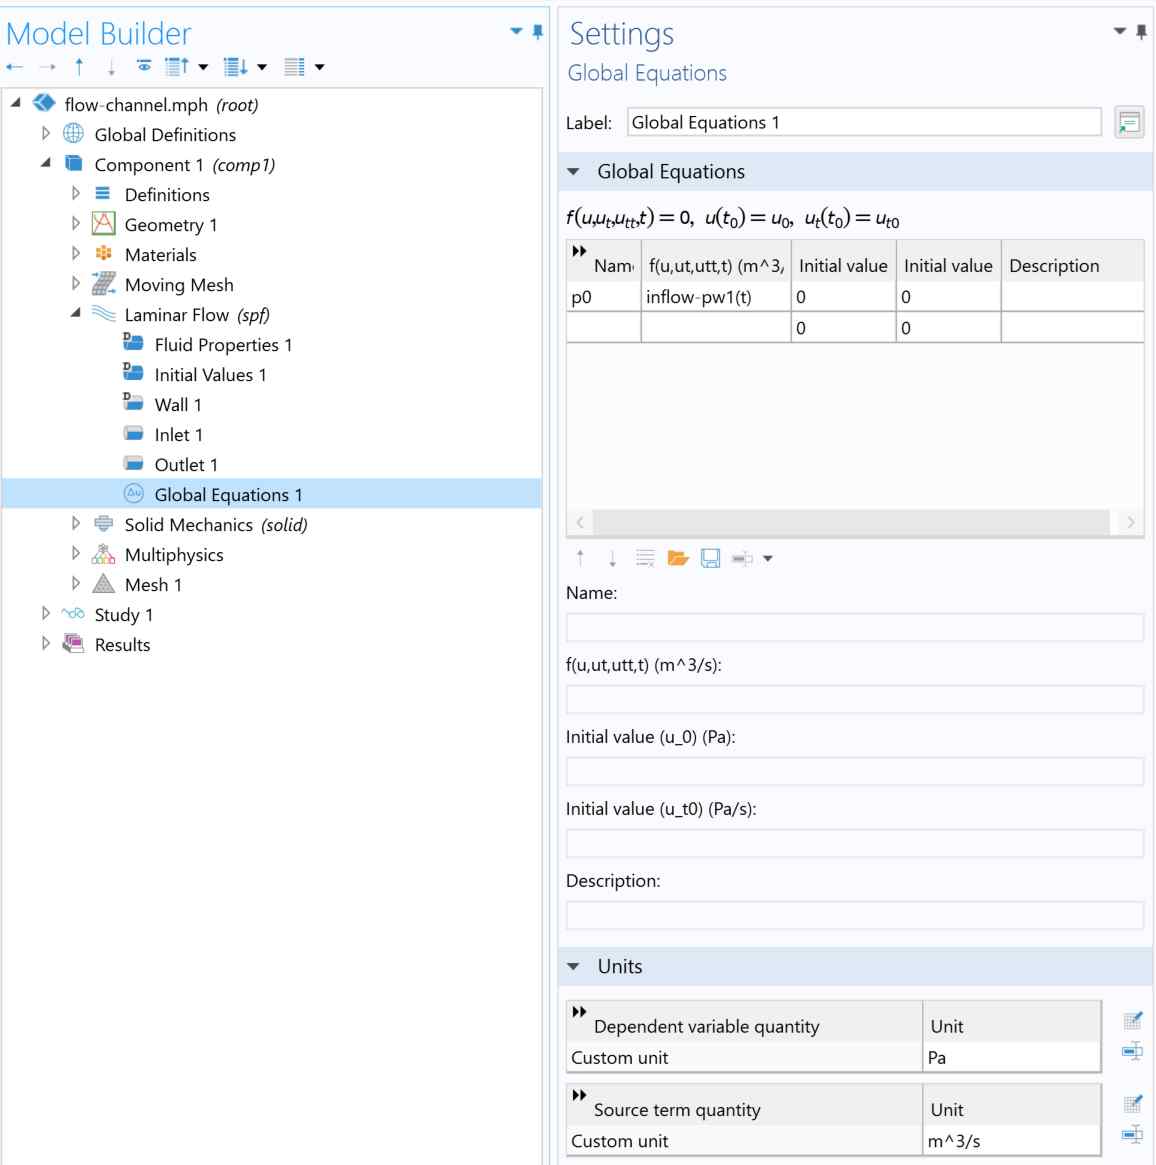
The inlet is assigned a pressure of \(p_0\), while the outlet has a pressure of 0. Since COMSOL lacks settings for a constant flow rate, a global equation node is employed to maintain a specified flow rate. This node allows the inlet pressure value to continuously update, aligning the inflow variable with the applied time-dependent flow rate.
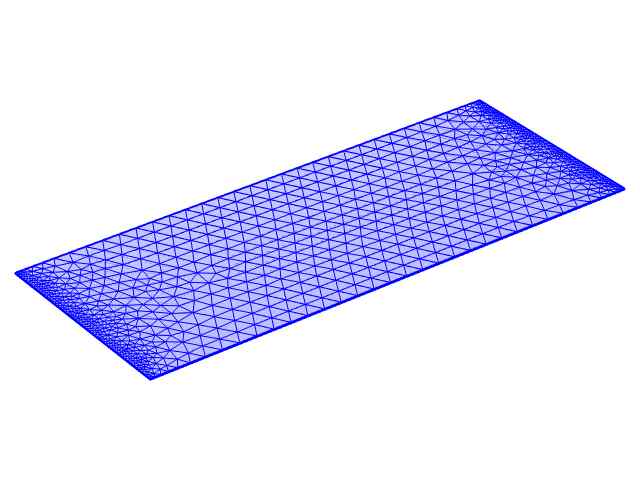
Meshing
The mesh starts from the narrow channel. The upper and lower surfaces are meshed with triangular mesh, and side surfaces are meshed by the mapped node, which imposes a uniform quad mesh along the thickness direction. The boundary layers are then used to mesh the channel interior. After the channel has been meshed, a free tetrahedral is used to mesh the rest of the PDMS and the substrate.
Results
Channel deformation
The deformation of the channel over time can be made into an animation. As the flow rate increases, the channel deforms more and more. When the flow rate gets stable at 5s, the channel deformation becomes constant.
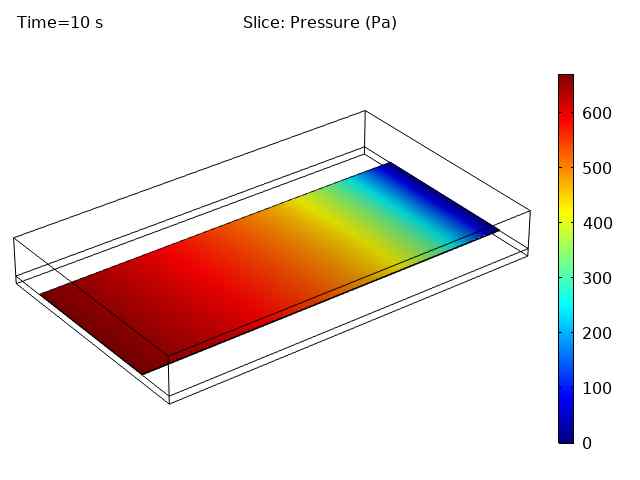
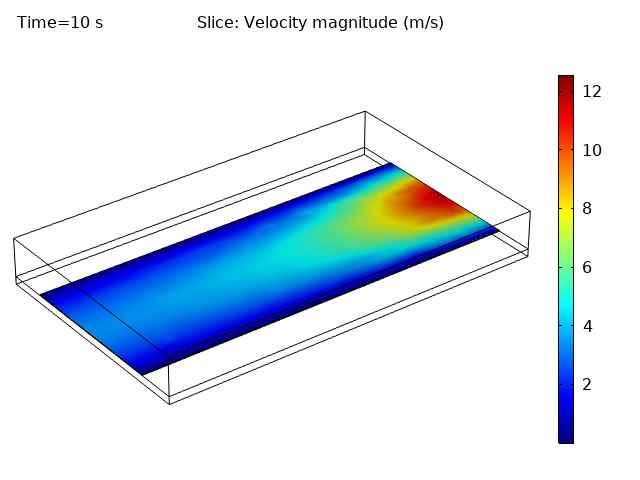
Pressure and Velocity
The pressure and velocity profile at the final time step are shown in the following. The pressure uniformly decreases to zero in the outlet as expected, while the velocity exhibits a hot spot at the output. The high velocity is probably a result of the low pressure, and therefore, small channel cross-section at the outlet. In other words, the flow velocity increases as a result of the reducing cross-section area so as to maintain a constant flow rate.
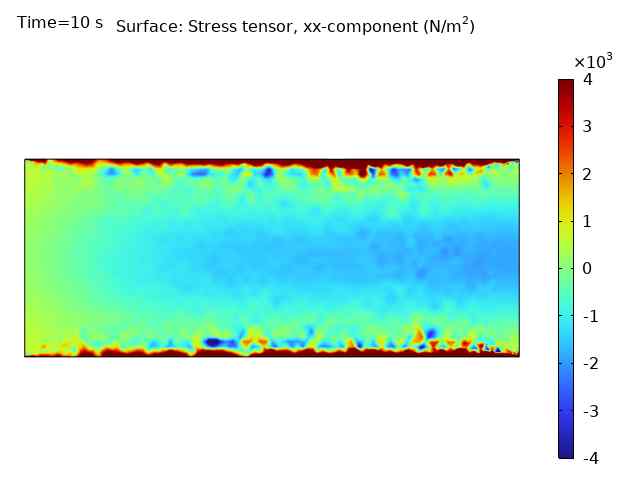
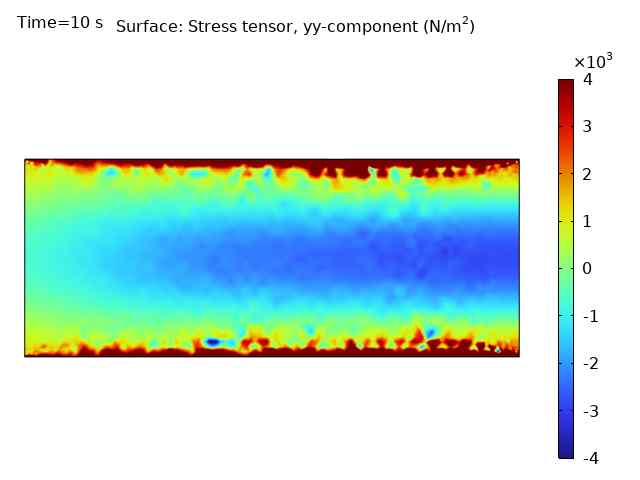
Stress Profile
The stress in the channel interior shows that at the center of the channel, the stress is compressive along and perpendicular to the flow direction. This stress transitions into tension as it gets closer to the bonding line between PDMS and the substrate. This stress transition profile is consistent with the experimental results observed in our paper.
The stress profile at the bounding edge has a poor accuracy, and it can be improved by further mesh refinement at the corresponding regions.
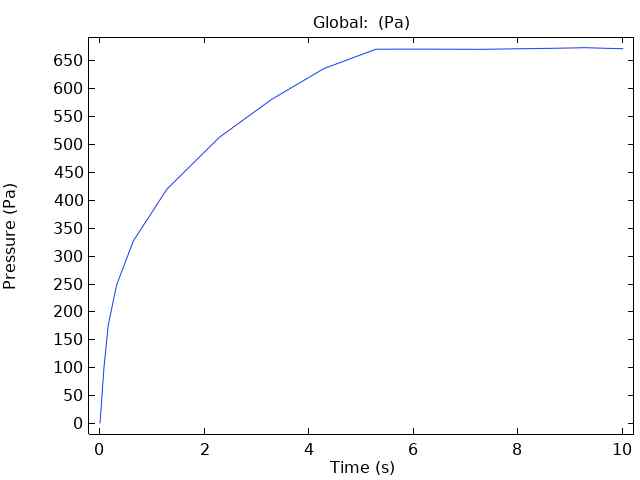
Flow Rate and Pressure
The flow rate obtained from integrating flow velocity across the inlet cross-section matches closely with the specified piecewise linear flow profile, indicating that the global equation is doing its job in implementing a controlled flow rate.
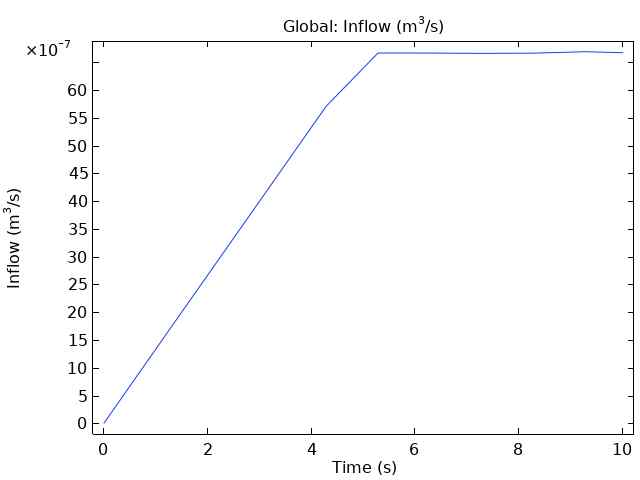
The pressure evolution is nonlinear over time, unlike the flow rate. Therefore, using pressure as the explicit control parameter will not work in generating a flow rate-controlled deformation profile.
Further extension
Once operational, the model can be verified by comparing the results with the previous study. This model can be readily extended to investigate channel deformation induced by different vapors by activating the parametric sweep node in the study section. This facilitates a detailed exploration of how gas flow properties influence channel deformation behavior, showcasing the sensor’s potential as a viscosity sensor and providing a reference for flow measurement in experimental validation. For additional insights into the application of this model, refer to our published paper.
Additionally, the piecewise linear flow rate profile can be adjusted to emulate the behavior of real-life mass flow controllers, thereby enhancing the accuracy of modeling time-dependent behavior. However, there is a limitation to reducing the flow rate rise time, as the smallest time step is tied to the mesh density in the transient study. Utilizing a smaller time step necessitates a denser mesh to maintain an acceptable Courant number for solver stability, resulting in a trade-off between modeling accuracy and computational cost.
To wrap up
This tutorial presents a comprehensive workflow for fluid-structure interaction simulation in COMSOL. It is essential to meticulously follow each step and adjust parameters based on your specific needs. The .m file of the model is accessible in this repository, which allows you to rebuild the model through COMSOL-MATLAB Livelink. For a quick overview of the model via the .mph file, please reach out to me or my supervisor for the original model file.
Funding: This work is funded by the National Institute for Materials Science (NIMS) and the University of Tsukuba, Japan.